

Canton and Quant gain over 5% as Bitcoin rebounds from $61,970 and Ethereum recovers from $1,710. Five crypto charts and key levels to watch on Nov. 16.
| Asset | Latest USD price | Past 24 hours | Market-wide 24h volume | Rank |
|---|---|---|---|---|
| Bitcoin (BTC) | $65,017 | +0.43% | $32.31 billion | 1 |
| Ethereum (ETH) | $1,824.48 | +0.50% | $11.82 billion | 2 |
| Canton (CC) | $0.083811 | +5.73% | $15.42 million | 25 |
| Quant (QNT) | $155.55 | +5.56% | $65.44 million | 39 |
| Zcash (ZEC) | $894.07 | −1.59% | $589.57 million | 11 |
Bitcoin rebounds but remains below two falling averages
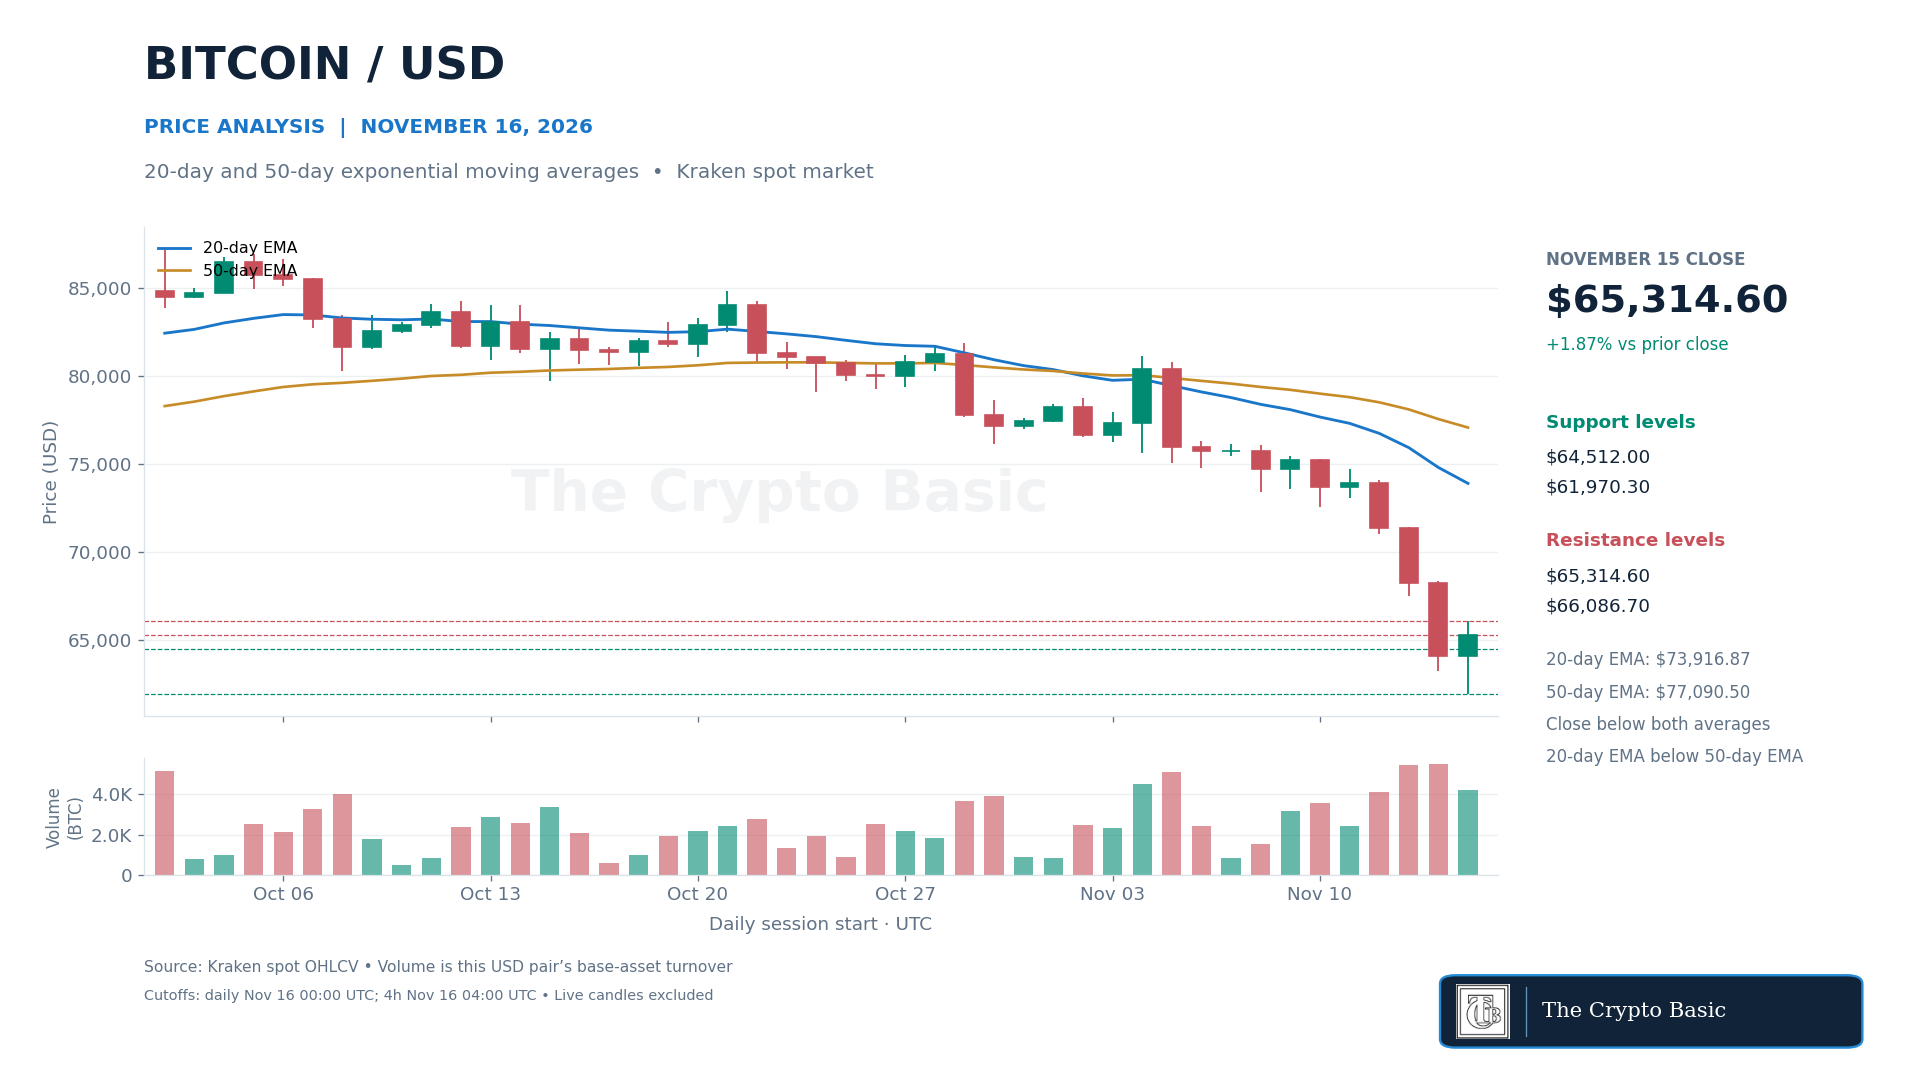
Bitcoin gained 1.87% on Sunday to close at $65,314.60 after trading between $61,970.30 and $66,086.70. The low was Bitcoin’s weakest price in 90 completed daily sessions.
The latest $65,017 price was 5.56% below the $68,848 recorded in the November 13 Bitcoin analysis .
The 20-day exponential moving average declined to $73,916.87, while the 50-day EMA fell to $77,090.50. Bitcoin remains below both averages, and the faster average remains below the slower one. Sunday’s rebound therefore improved the latest candle without changing the established bearish alignment.
The completed four-hour candle closed at $65,048.30, below its 20-period EMA at $66,886.16 and 50-period EMA at $70,239.19.
A daily close above $66,086.70 would clear Sunday’s high and weaken the immediate lower-high structure. Bitcoin would still need to reclaim the daily 20-day EMA to improve the broader trend.
A close below the four-hour support at $64,512 would put $61,970.30 back in focus. Losing Sunday’s low would confirm another downside extension.
Ethereum rebound does not reverse its bearish daily MACD
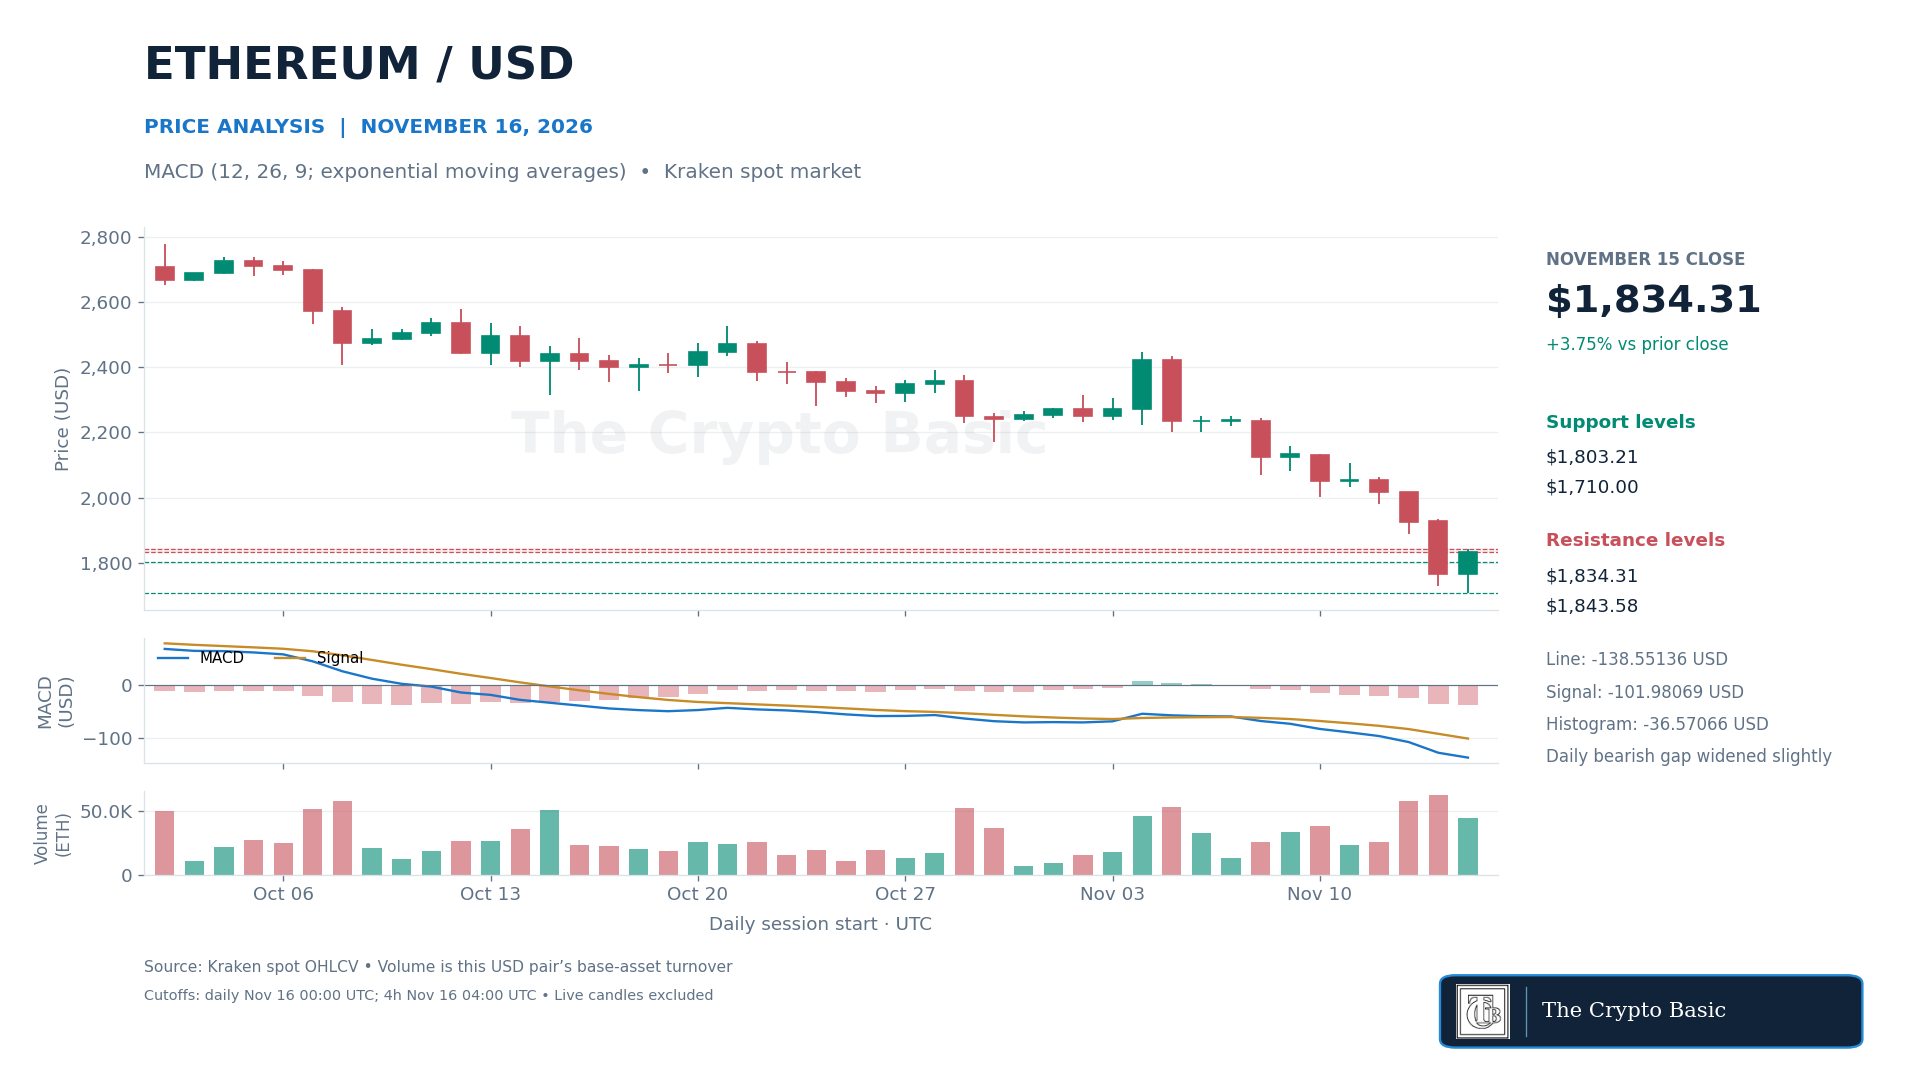
Ethereum rose 3.75% on Sunday to close at $1,834.31 after falling to $1,710 and reaching $1,843.58. The $1,710 low was the weakest price in the latest 90 completed daily sessions.
The latest $1,824.48 price was 3.45% below the $1,889.65 recorded in the November 14 Ethereum analysis .
Daily MACD, using 12- and 26-period exponential moving averages with a nine-period signal EMA, remained bearish. The MACD line fell to −$138.55 against a −$101.98 signal.
The histogram widened slightly to −$36.57 from −$36.38. Sunday’s positive candle therefore did not produce a bullish daily crossover or an improvement in the line-signal gap.
The latest completed four-hour MACD was more constructive, with the line above its signal and a positive $4.81 histogram. That shorter-term improvement still needs price confirmation.
A daily close above $1,843.58 would clear Sunday’s high and invalidate the immediate lower-high risk. A close below $1,803.21 would weaken the rebound, while losing $1,710 would confirm another extension beneath the new 90-day low.
Canton rebounds on volume 50% above its recent average
Canton advanced 10.35% on Sunday to close at $0.08570 after recovering from $0.07499 and reaching $0.08576. The latest price was lower than Sunday’s close but remained up 5.73% over the past 24 hours.
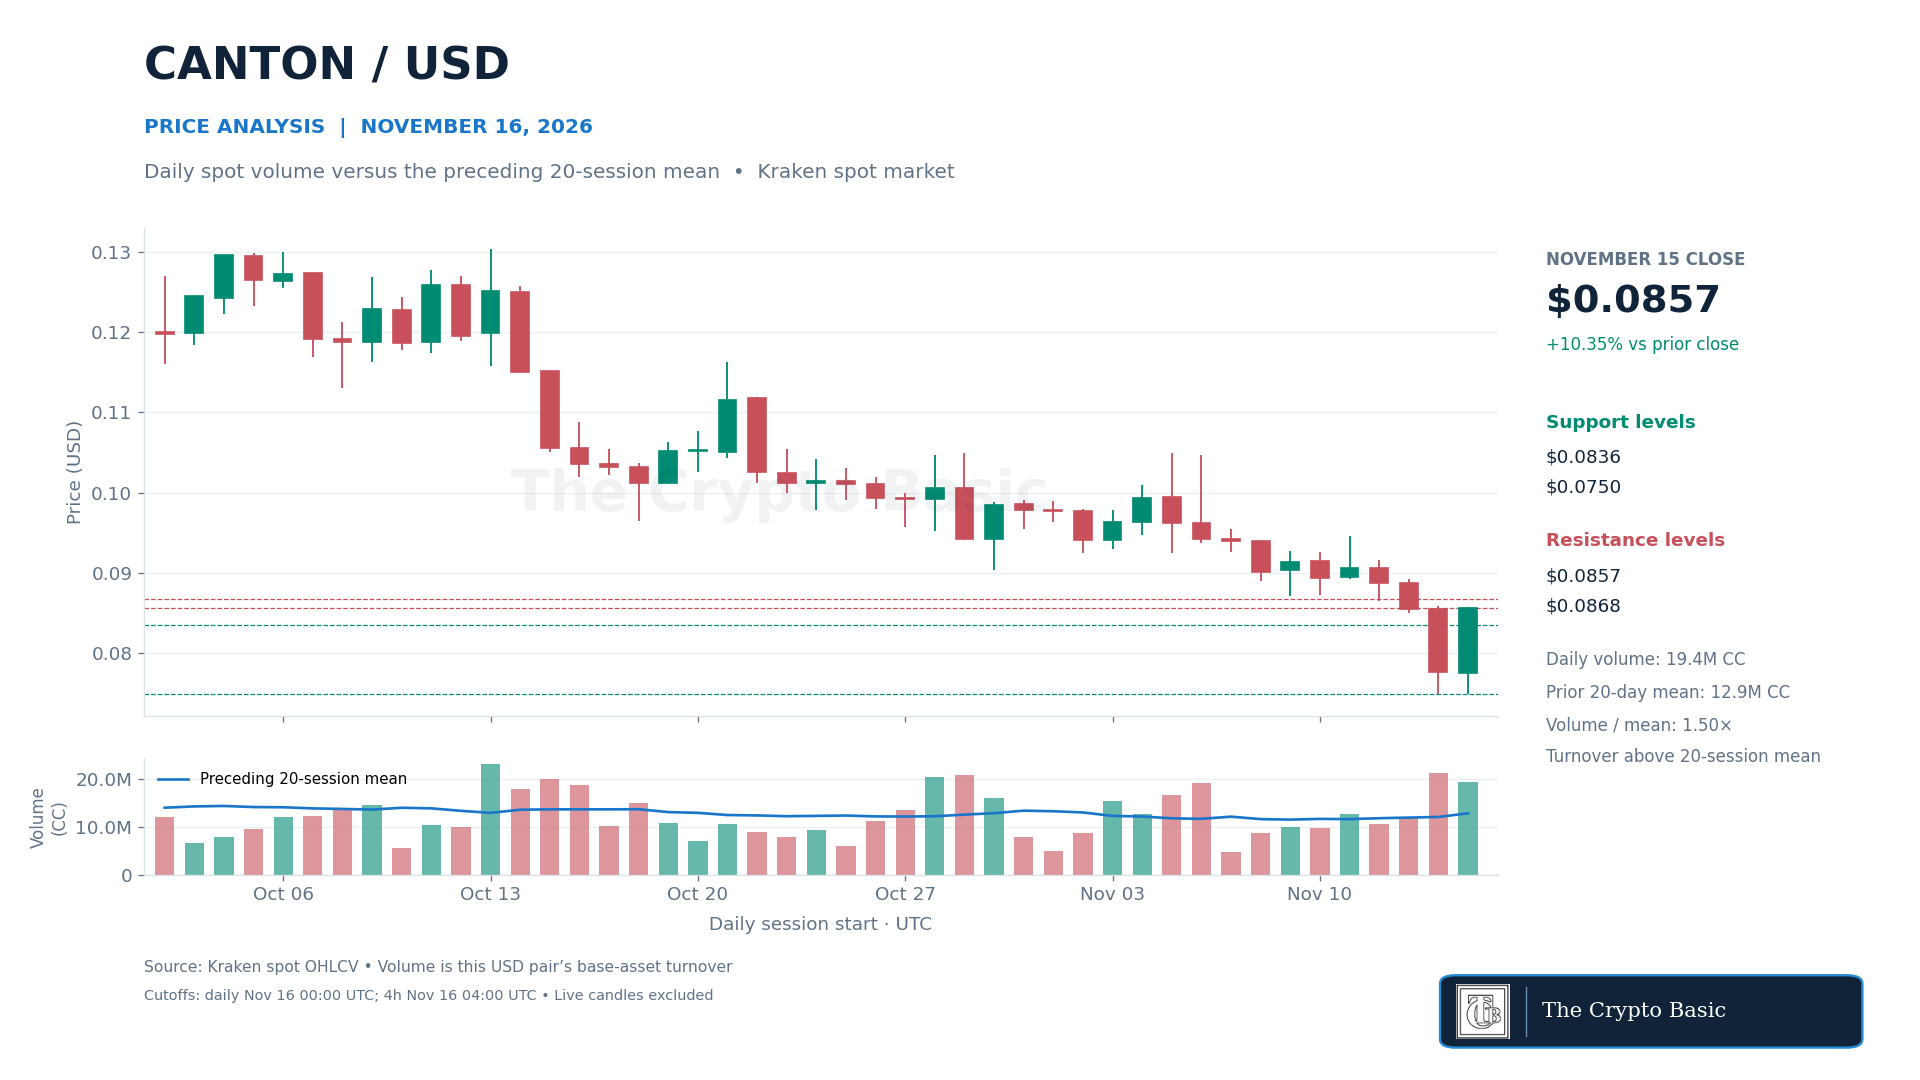
Approximately 19.4 million CC changed hands on the Kraken spot USD pair, compared with a preceding 20-session average near 12.9 million CC. Sunday’s exchange turnover was therefore 1.50 times its recent average.
This genuine per-candle volume accompanied the rebound, while the market-wide USD total is reported separately in the table.
The latest completed four-hour candle reached $0.08676 before closing at $0.08395. A daily close above $0.08676 would extend the rebound toward the November 11 high at $0.09458.
A close below $0.08359 would weaken the short-term hold, while losing Sunday’s $0.07499 low would invalidate the rebound and establish a fresh 90-session low.
Canton has not appeared in the recent Price Desk sequence, so no prior article price is used for comparison.
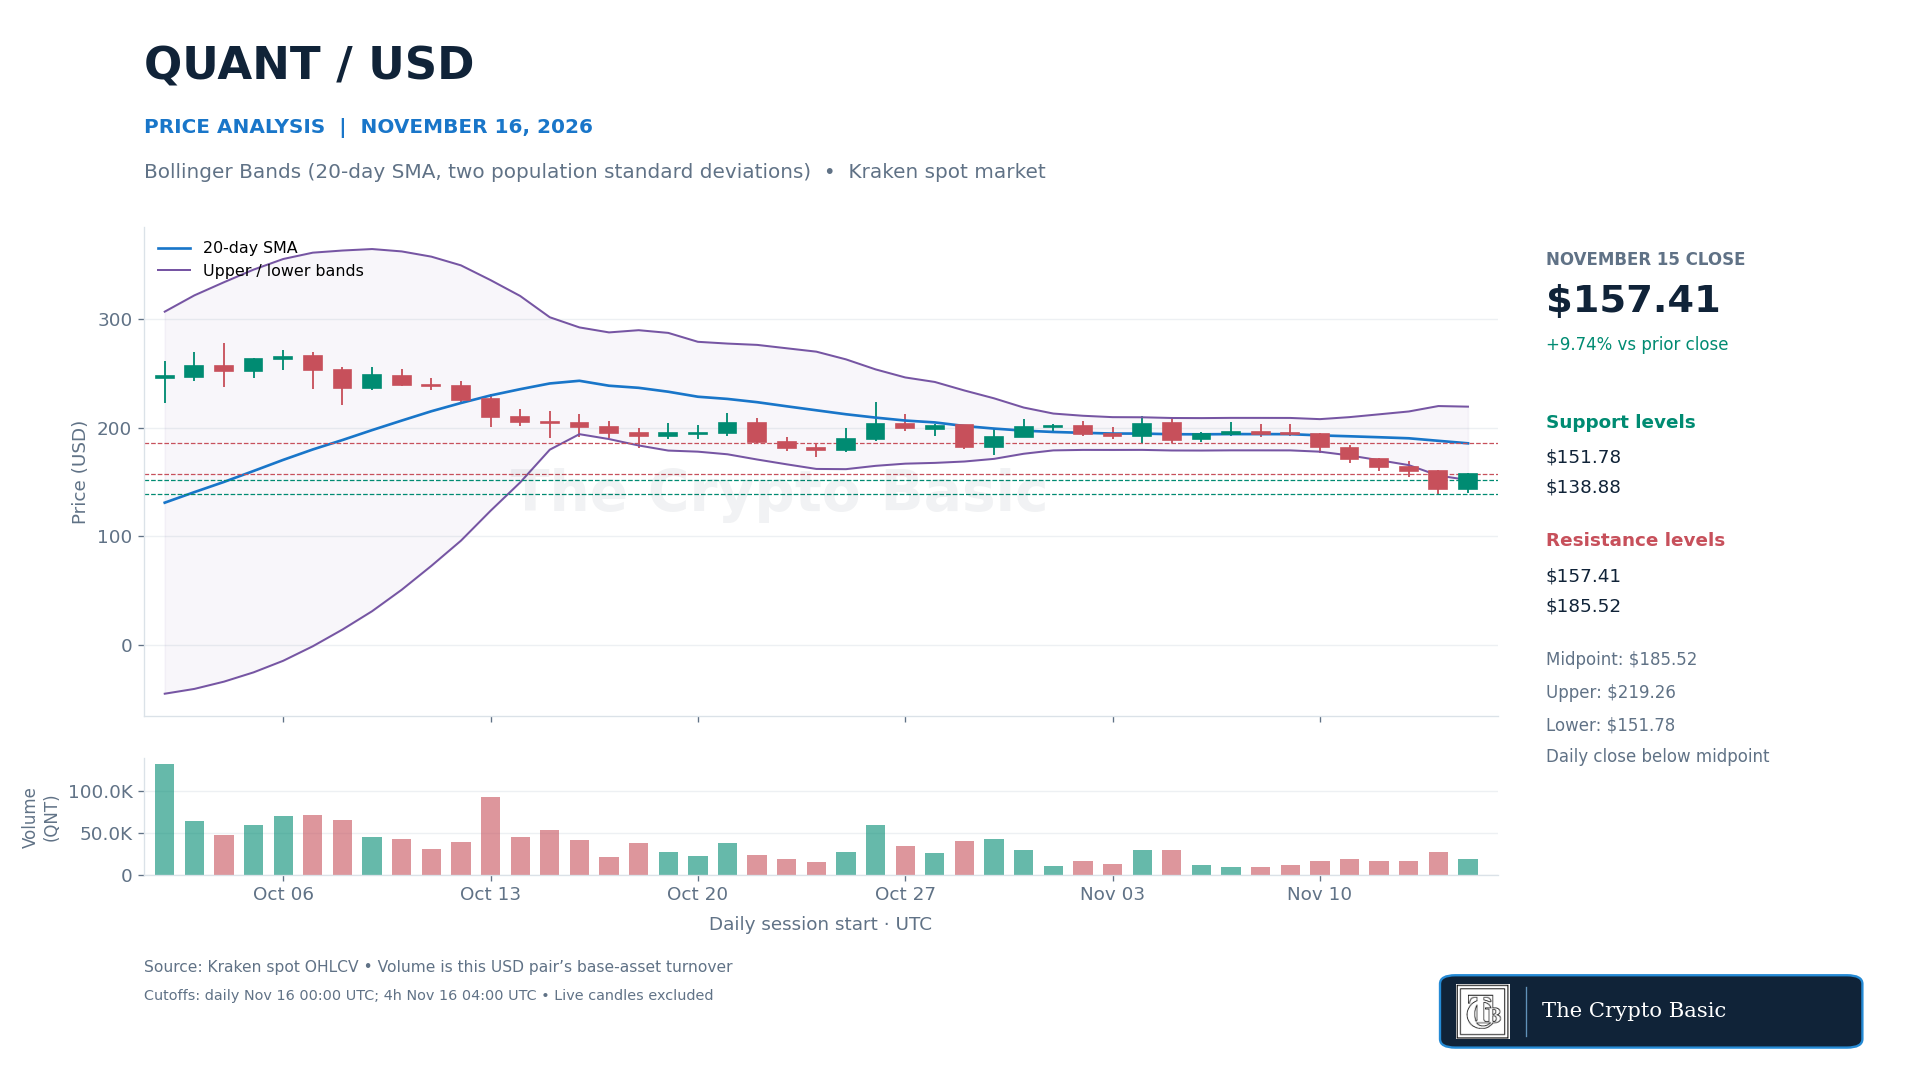
Quant closes back inside its lower Bollinger Band
Quant gained 9.74% on Sunday to close at $157.41 after trading from $140 to $158.23. The advance followed Saturday’s decline to $138.88.
The latest $155.55 price was 17.74% below the $189.10 recorded in the October 26 Quant analysis .
Daily Bollinger Bands use a 20-day simple moving average with two population standard deviations. The midpoint fell to $185.52, while the lower and upper bands stood at $151.78 and $219.26.
Saturday closed below its lower band, but Sunday recovered above the recalculated boundary. This marks a return inside the band envelope rather than a confirmed trend reversal.
The latest completed four-hour close was $155.80, close to the four-hour midpoint at $155.82.
A daily close above $158.23 would clear Sunday’s high, while reclaiming the falling daily midpoint at $185.52 would provide much stronger recovery confirmation.
A close below the lower band at $151.78 would weaken the rebound. Losing $138.88 would invalidate it and confirm a fresh decline.
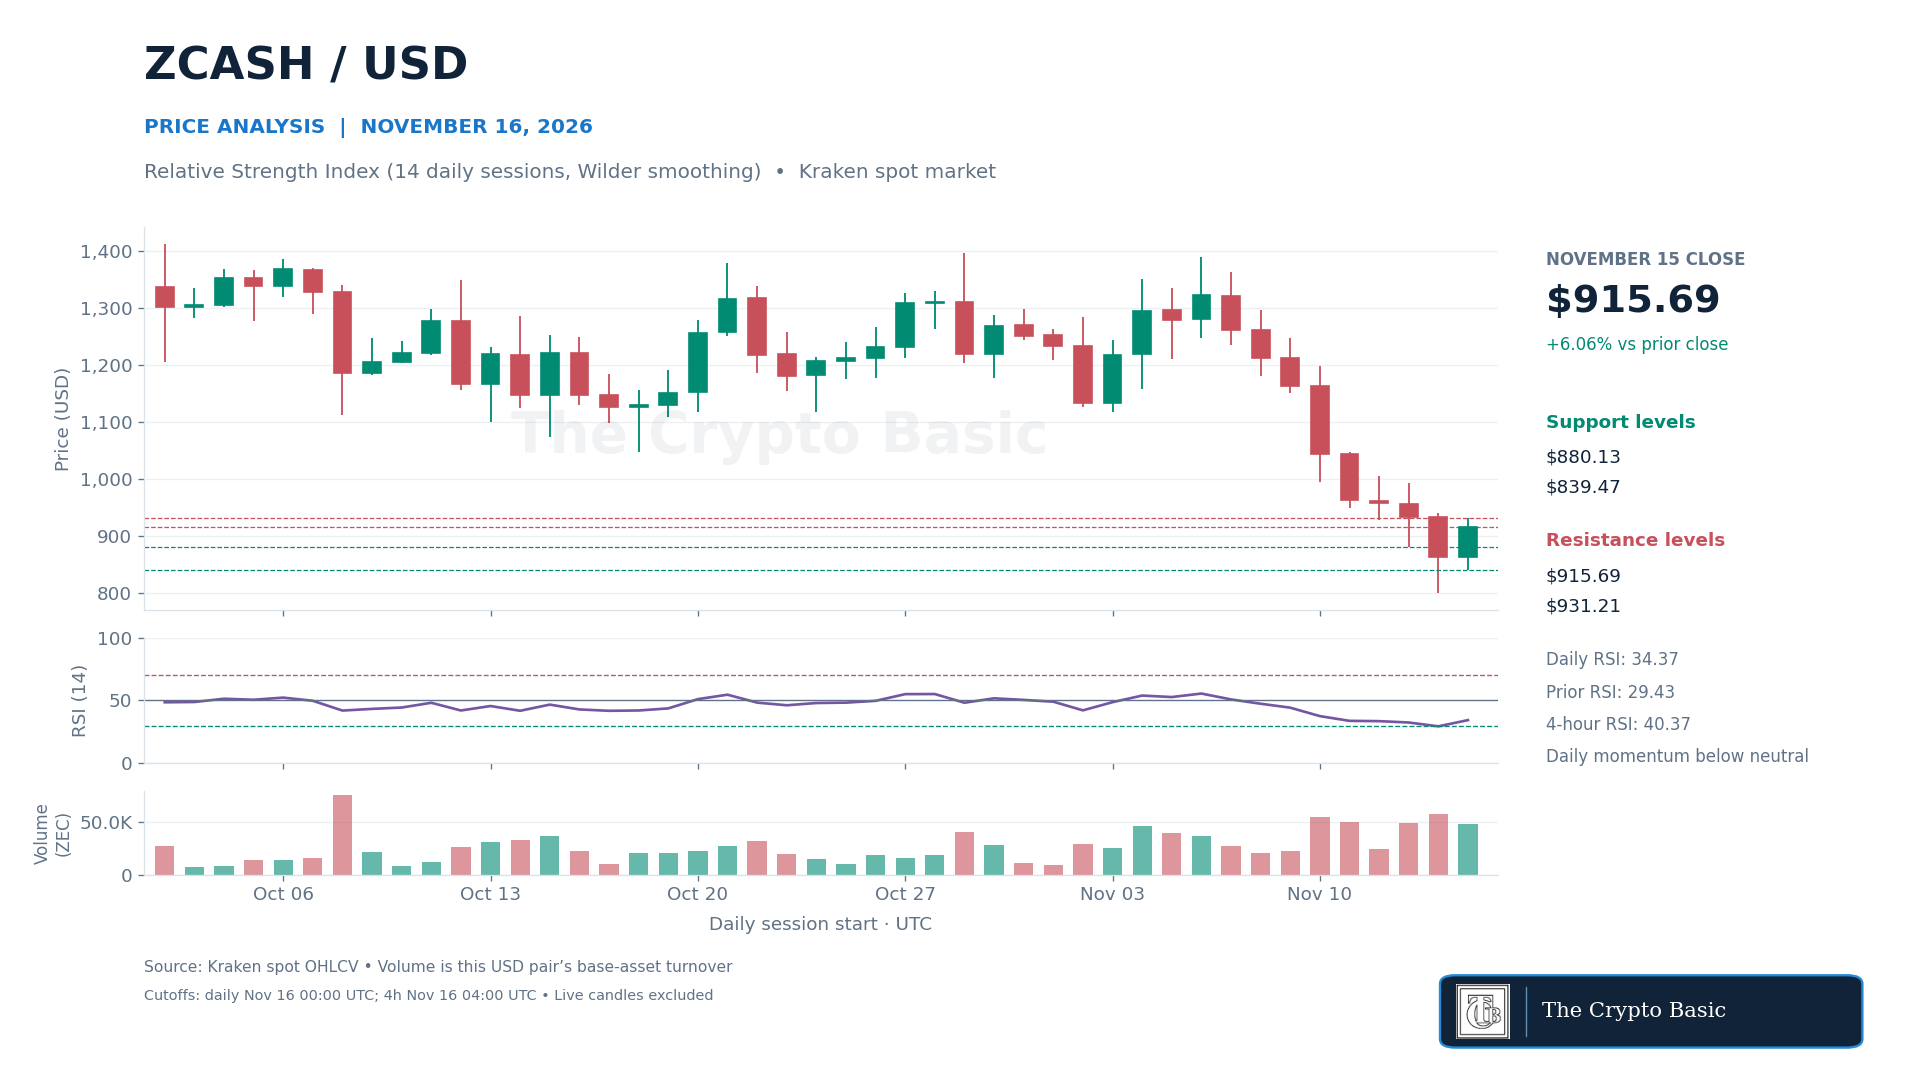
Zcash RSI recovers from oversold as resistance holds
Zcash rose 6.06% on Sunday to close at $915.69 after trading between $839.47 and $931.21.
The latest price was 3.87% below the $930.07 recorded in the November 13 Zcash analysis .
The 14-day Relative Strength Index, calculated with Wilder smoothing, rose to 34.37 from 29.43. RSI therefore recovered above the conventional oversold threshold of 30 on the completed daily candle, but it remained below the neutral 50 line.
The signal shows improved momentum without confirming a sustained reversal. The latest completed four-hour RSI was firmer at 40.37 as the candle closed at $897.30.
A daily close above $931.21 would clear Sunday’s high and strengthen the recovery. Reclaiming $1,000 would provide a broader repair after the recent decline.
A close below $880.13 would weaken the short-term hold, while losing $839.47 would expose Saturday’s $800.87 low and invalidate the latest rebound.