




Bitcoin changed hands at $74,561 at 08:53 UTC on Nov. 10, back below the $75,000 handle. Spot Bitcoin ETFs bled money in six of their last seven sessions, and the October inflation report lands at 13:30 UTC.
The 24-hour change is almost flat, up 0.2%, so the headline understates the damage. BTC is 2.8% below its Nov. 3 close, 10.1% lower over 30 days, and 40.9% under the October 2025 record of $126,080, according to CoinGecko . The overnight low was $73,999.
- Price: $74,561 at 08:53 UTC, 24-hour range of $73,999 to $75,477.
- Flows: the seven sessions through Nov. 9 produced a net $2.13 billion of redemptions across US spot Bitcoin funds, per Farside Investors .
- Concentration: BlackRock’s IBIT accounted for $1.66 billion, or 77.9%, of that total.
- Catalyst: October CPI is scheduled for 08:30 ET, after September’s 3.7% annual print.
The tape at 08:53 UTC
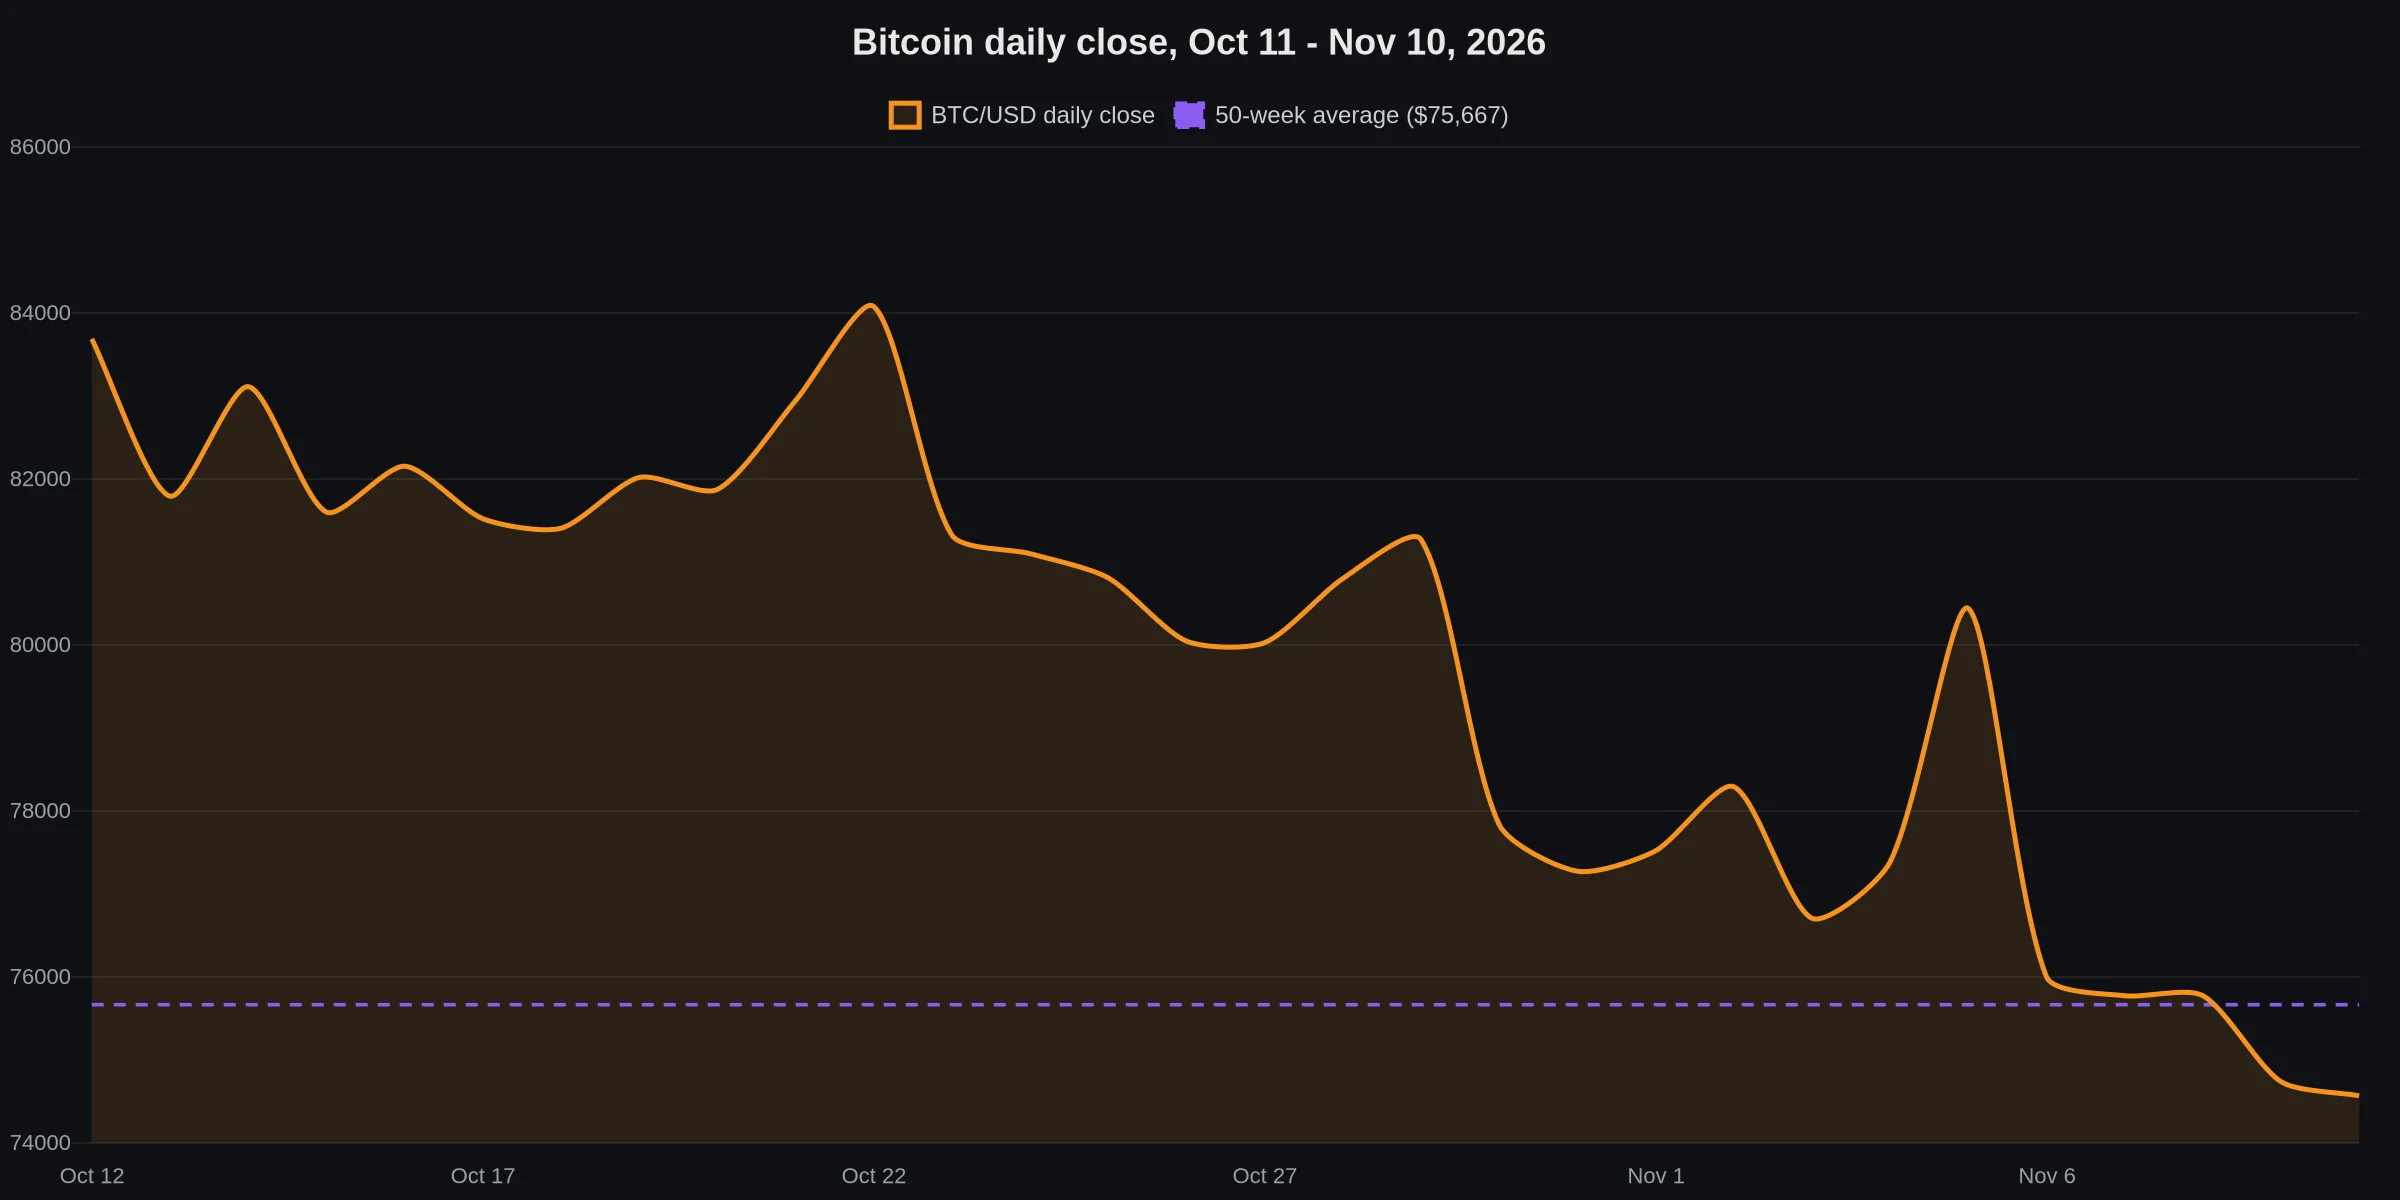
The last time Bitcoin printed a daily close this low was Aug. 21, on CoinGecko’s daily series. It has spent the past three weeks grinding lower from an Oct. 22 close of $84,082, and the bounce toward $80,443 on Nov. 5 lasted a single session before sellers took it back to $76,006.
Market capitalization sits at $1.499 trillion on $24.58 billion of 24-hour volume. The $1,478-wide overnight range is narrow against the moves of the past fortnight, and the price is holding a corridor between two widely watched averages.
What changed today is positioning, not the narrative. Bitcoin is now below its 50-week average and above its 200-day average, squeezed into a band roughly $2,500 wide. That is a decision point, and the CPI print lands inside it.
Six Redemptions in Seven Sessions, and One Fund Behind Most of Them
Farside’s daily fund-level data shows the exit is not spread evenly across the twelve US spot Bitcoin products. BlackRock’s IBIT has carried almost four-fifths of it.
| Session | IBIT | FBTC | ARKB | GBTC | BITB | Rest | Total |
|---|---|---|---|---|---|---|---|
| Oct. 30 | -233.7 | -201.0 | -129.5 | -53.3 | -25.7 | 0.0 | -643.2 |
| Nov. 2 | -405.3 | 6.7 | 0.0 | 0.0 | 0.0 | 0.0 | -398.6 |
| Nov. 3 | -95.0 | 6.8 | 0.0 | 0.0 | 21.9 | -49.3 | -115.6 |
| Nov. 4 | -201.2 | 236.7 | 19.9 | 0.0 | 15.2 | 4.0 | 74.6 |
| Nov. 5 | -105.0 | -199.9 | -18.9 | -49.9 | 0.0 | -56.5 | -430.2 |
| Nov. 6 | -403.0 | 42.8 | -20.1 | -11.1 | -20.5 | 0.0 | -411.9 |
| Nov. 9 | -213.2 | 0.0 | -9.9 | 0.0 | 0.0 | 22.1 | -201.0 |
| Seven sessions | -1,656.4 | -107.9 | -158.5 | -114.3 | -9.1 | -79.7 | -2,125.9 |
Figures in US$ millions; negative is net redemption. “Rest” covers MSBT, BTC, EZBC, HODL and BTCO. Source: Farside Investors, daily fund flows through Nov. 9.
Read the FBTC column before drawing conclusions from the total. Fidelity’s fund took in $236.7 million on Nov. 4 and another $42.8 million on Nov. 6, and its seven-session net is a modest -$107.9 million. ARKB lost $158.5 million and GBTC $114.3 million. Neither is a stampede.
IBIT is the outlier. It shed money on all seven sessions, including a $403.0 million redemption on Nov. 6 and $405.3 million on Nov. 2. A fund that size bleeding $1.66 billion in seven sessions reads more like a large allocator trimming or unwinding a position than like retail capitulation.
The usual shape of a retail exit shows up in the smaller, more expensive products first. Those funds are close to flat over the same stretch.
What $2.13 Billion Is in Bitcoin
At the average daily close across those seven sessions, $76,691, the net redemption equals roughly 27,700 BTC . That is more than twice the 13,597 BTC MARA Holdings disclosed selling to retire debt earlier today. IBIT’s own share works out to about 21,600 BTC.
Set it against the cumulative $55.57 billion of net inflows the US spot Bitcoin complex has absorbed since January 2024. Seven sessions just removed 3.8% of that. Meaningful, not structural.
A 40% drawdown from the record is too large to pin on one bad fortnight of ETF accounting. The more likely weight sits with the marginal buyer that arrived through these funds in 2025 and has now stopped arriving.
The distinction matters for anyone trying to read the next month. A 3.8% trim can reverse in two good sessions. A change in the marginal buyer is a slower problem.
Two Averages Now Bracket a Falling Price
The chart below plots daily closes from Oct. 11 to Nov. 10 against the 50-week average, currently $75,667. Bitcoin closed below it on Nov. 9 and stayed below it overnight, extending the break that began when it lost the 50-week line as ETFs shed $1.28 billion .
Three levels matter, all computed from CoinGecko daily closes through Nov. 9 using simple moving averages:
- Support at $73,158 is the 200-day average. A daily close beneath it would put the Aug. 21 close of $73,021 and the August consolidation back in play. That is the invalidation for any recovery thesis built on the long-term trend.
- Resistance at $75,667 is the 350-day, or 50-week, average. A close above it would neutralise last week’s breakdown and shift focus back to $78,590, the 20-day average.
- Momentum is soft but not washed out. The 14-day relative strength index on the same series reads 35.2, still above the 30 threshold conventionally used to mark oversold conditions.
That combination, price under the long average with RSI just above oversold, is why the next two daily closes matter more than the last ten. Sellers have room to push toward $73,158 without producing a single technical extreme.
The 13:30 UTC Print That Sets the Next Move
The Bureau of Labor Statistics publishes October CPI at 08:30 ET, 13:30 UTC, according to the BLS release calendar . September set the bar high.
The BLS reported that “the index for gasoline rose 9.1 percent in September, accounting for over half of the monthly all items increase,” and that “the energy index increased 5.2 percent over the month.”
The agency added that “the all items index rose 3.7 percent for the 12 months ending September, a larger increase than the 3.4-percent increase reported for the 12 months ending in August.” Core inflation came in at 0.3% monthly and 2.6% annually, per the September release .
The monthly path has been uneven, which is why one print can move rate expectations quickly.
| Month | Mar | Apr | May | Jun | Jul | Aug | Sep |
|---|---|---|---|---|---|---|---|
| All items, m/m | 0.9% | 0.6% | 0.5% | -0.4% | 0.1% | 0.4% | 0.6% |
| Core, m/m | 0.2% | 0.4% | 0.2% | 0.0% | 0.2% | 0.3% | 0.3% |
Source: BLS Consumer Price Index, seasonally adjusted monthly changes.
September’s acceleration came mostly from energy. Gasoline rose 9.1% on the month and energy 5.2%, with the energy index up 20.4% over the year. Core inflation, the part the rate path actually tracks, has run between 0.0% and 0.4% a month since March, and the September print pushed Bitcoin below $82,000 when it landed on Oct. 14.
Three outcomes are worth pre-defining, each with its own trigger rather than a forecast:
- Core at 0.2% or lower. The disinflation argument survives, front-end yields would have room to fall, and the setup favours a reclaim attempt at $75,667. Invalidation: a close back under $73,999.
- Core at 0.3%. The base case on the September trend. Expect the corridor between $73,158 and $75,667 to hold into the US afternoon, with direction decided by ETF flow data after the close.
- Core at 0.4% or higher. A third consecutive upside surprise would harden the case for tighter policy. The 200-day average at $73,158 becomes the line in the sand, and a close below it opens the August range.
Treat each of those as a conditional path, not a prediction. The evidence available today does not establish that ETFs are causing the decline; it shows redemptions and price falling in the same window, with the direction of causation unresolved.
The Case That Flows Are Following Price, Not Leading It
ETF flow data is reported with a lag and reflects orders placed the previous session. When Bitcoin drops 5% in a day, the redemptions printed the next morning are partly a reaction to that drop, not its cause. That is the strongest argument against reading the $2.13 billion as a forward-looking signal.
The Nov. 4 session makes the point. FBTC pulled in $236.7 million and the complex as a whole took in $74.6 million while price rose to a $77,385 close. Bitcoin then fell to $80,443 the next session on a $430.2 million outflow. Flows and price have moved together for a fortnight without a clear leader.
There is also the composition problem. A redemption from IBIT can be a basis-trade unwind, a model-portfolio rebalance, or an allocator trimming a position that is still up on the year. None of those require a directional view on Bitcoin, and none show up in the flow number.
Attributing a $9,521 slide from the Oct. 22 close to one fund’s redemptions is the kind of causal claim the data cannot support.
What the flows do show, without interpretation, is that the largest and cheapest US spot vehicle has been a net seller for seven consecutive sessions while its main competitors have not. Whatever the cause, that is where the marginal supply is coming from.
What Would Flip the Read
Two consecutive sessions of net inflows across the complex would be the first clean break in the pattern, and IBIT specifically turning positive would matter more than the aggregate. On price, a daily close back above $75,667 would neutralise the 50-week breakdown; a close below $73,158 would confirm it.
After today, the next scheduled test is the November CPI report on Dec. 10. Between the two, the flow data at the close is the only high-frequency input that speaks to who is actually selling.
Frequently Asked Questions
Bitcoin traded at $74,561 at 08:53 UTC, down 2.8% from its Nov. 3 close. Six of the last seven sessions brought net redemptions from US spot Bitcoin ETFs, totalling $2.13 billion, with BlackRock’s IBIT responsible for $1.66 billion of it. The October CPI report is also due at 13:30 UTC, which has kept buyers cautious.
The Bureau of Labor Statistics schedules the October 2026 Consumer Price Index for 08:30 ET on Nov. 10, which is 13:30 UTC. September’s report showed all items up 0.6% on the month and 3.7% over the year, with core inflation at 0.3% monthly and 2.6% annually.
Yes, on a net basis over the past seven sessions. Farside’s fund-level data shows $2.13 billion of net redemptions between Oct. 30 and Nov. 9, with one positive session on Nov. 4. The selling is concentrated: IBIT accounts for 77.9% of the total, while FBTC’s net outflow is only $107.9 million.
The 200-day average at $73,158 is the line that separates a pullback from a trend break, based on CoinGecko daily closes through Nov. 9. Above it, the 50-week average at $75,667 is the level Bitcoin needs to reclaim to undo last week’s breakdown.
Disclosure: This article does not represent investment advice. The content and materials featured on this page are for educational purposes only.