



The best crypto to buy now is Bitcoin, but only with a stop attached. BTC trades at $76,123 on Nov 6, down 5.3% in 24 hours and 9.5% below its 30-day high, after $1.26 billion of leverage was liquidated across derivatives venues. That makes the trade a defined-risk test of $76,000, not a market order.
The damage was almost entirely one-sided. CoinGlass logged $1.12 billion of long liquidations against $150.04 million of shorts over the trailing 24 hours, a ratio of 7.5 to one, across 241,242 accounts. Bitcoin accounted for $335.11 million of that, Ethereum $214.08 million, and every other asset combined $183.87 million. The largest single order was a $10.94 million ETHUSDT long on Binance that was closed at $2,243.86, per the BTC liquidation table .
The Forced Selling Was Front-Loaded
Look at the shape of the day rather than the headline number. Of the $1.12 billion in long liquidations, only $158.94 million happened in the last 12 hours. The remaining $961 million, or 86% of the long-side total, was booked between 12 and 24 hours ago, during the Nov 5 US session. The last four hours produced $27.75 million and the last hour $9.01 million.
That sequencing matters for anyone deciding whether to buy. A liquidation cascade that is decelerating is a different object from one that is still running: the marginal forced seller has already been removed, and price is now sitting on the spot bids that survived. It is also not evidence of a bottom. It only says the mechanical selling pressure visible in the derivatives book has faded.
Exchange concentration tells the same story. Binance carried 45.2% of the day’s liquidations, with OKX, Bybit, Hyperliquid and Gate splitting most of the rest. When one venue absorbs nearly half the forced flow, the print is a liquidity event on that venue’s book, not a verdict on the asset.
ETF Money Left Before the Leverage Did
Spot ETF flows turned before the perp flush, and in the opposite direction from the day before. US spot Bitcoin ETFs recorded a net outflow of $430.2 million on Nov 5, according to Farside Investors : FBTC lost $199.9 million, IBIT $105.0 million, GBTC $49.9 million, EZBC $32.9 million, HODL $23.6 million and ARKB $18.9 million.
The session before, Nov 4, was positive at $74.6 million. That single fact rules out the phrase “outflow streak” that will appear in a dozen recaps today. What the data does support is a slower, larger drain: across the five sessions from Oct 30 to Nov 5, the same funds bled $1,513.0 million net, including $643.2 million on Oct 30 and $398.6 million on Nov 2.
Put those two numbers side by side and the scale changes. The Nov 5 ETF redemption of $430.2 million equals roughly 34% of the entire 24-hour liquidation total. Perp liquidations are loud and fast; ETF redemptions are quiet and slow, and they hit the spot bid rather than a leveraged position. A day of forced selling on a derivatives venue is recoverable within hours. Four negative ETF sessions in five is not.
This is the mirror image of Nov 5, when shorts absorbed a $741 million liquidation day while ETF flows turned positive. Same instruments, opposite side of the book, opposite conclusion.
The Semis Were in the Same Liquidation Book
The CoinGlass heatmap is not a pure crypto print. Its top liquidation list for the last 24 hours includes SanDisk at $58.51 million, the leveraged semiconductor ETF SOXL at $57.20 million, Micron at $17.27 million, SK Hynix at $14.43 million and the KORU Korea ETF at $17.88 million, alongside an index position tagged to the S and P 500 at $12.96 million.
Read that carefully before drawing a causal arrow. Tokenized-equity and stock perps are traded on the same venues and margined against the same collateral, so a de-grossing event in semiconductor exposure shows up in the crypto liquidation tape whether or not crypto was the target. The overlap proves a shared risk channel was being cut. It does not prove that equities caused the Bitcoin move, and the available evidence does not establish which market led.
What it does establish is that the $1.26 billion should be read as a cross-asset de-risking number, not as a crypto-only figure. Any analysis that quotes it as proof of crypto-specific capitulation is overreading the data.
Where the Levels Actually Sit
BTC is trading below both of its short-term averages, which is the cleanest description of the current structure. The 20-day average of daily closes is $79,695.80 and the 50-day is $82,000.12, computed from CoinGecko daily data. Spot sits 4.5% under the first and 7.2% under the second. The 30-day range runs from today’s low of $76,005.51 to $84,082.27, and the current price is the second-lowest of the past 30 daily closes.
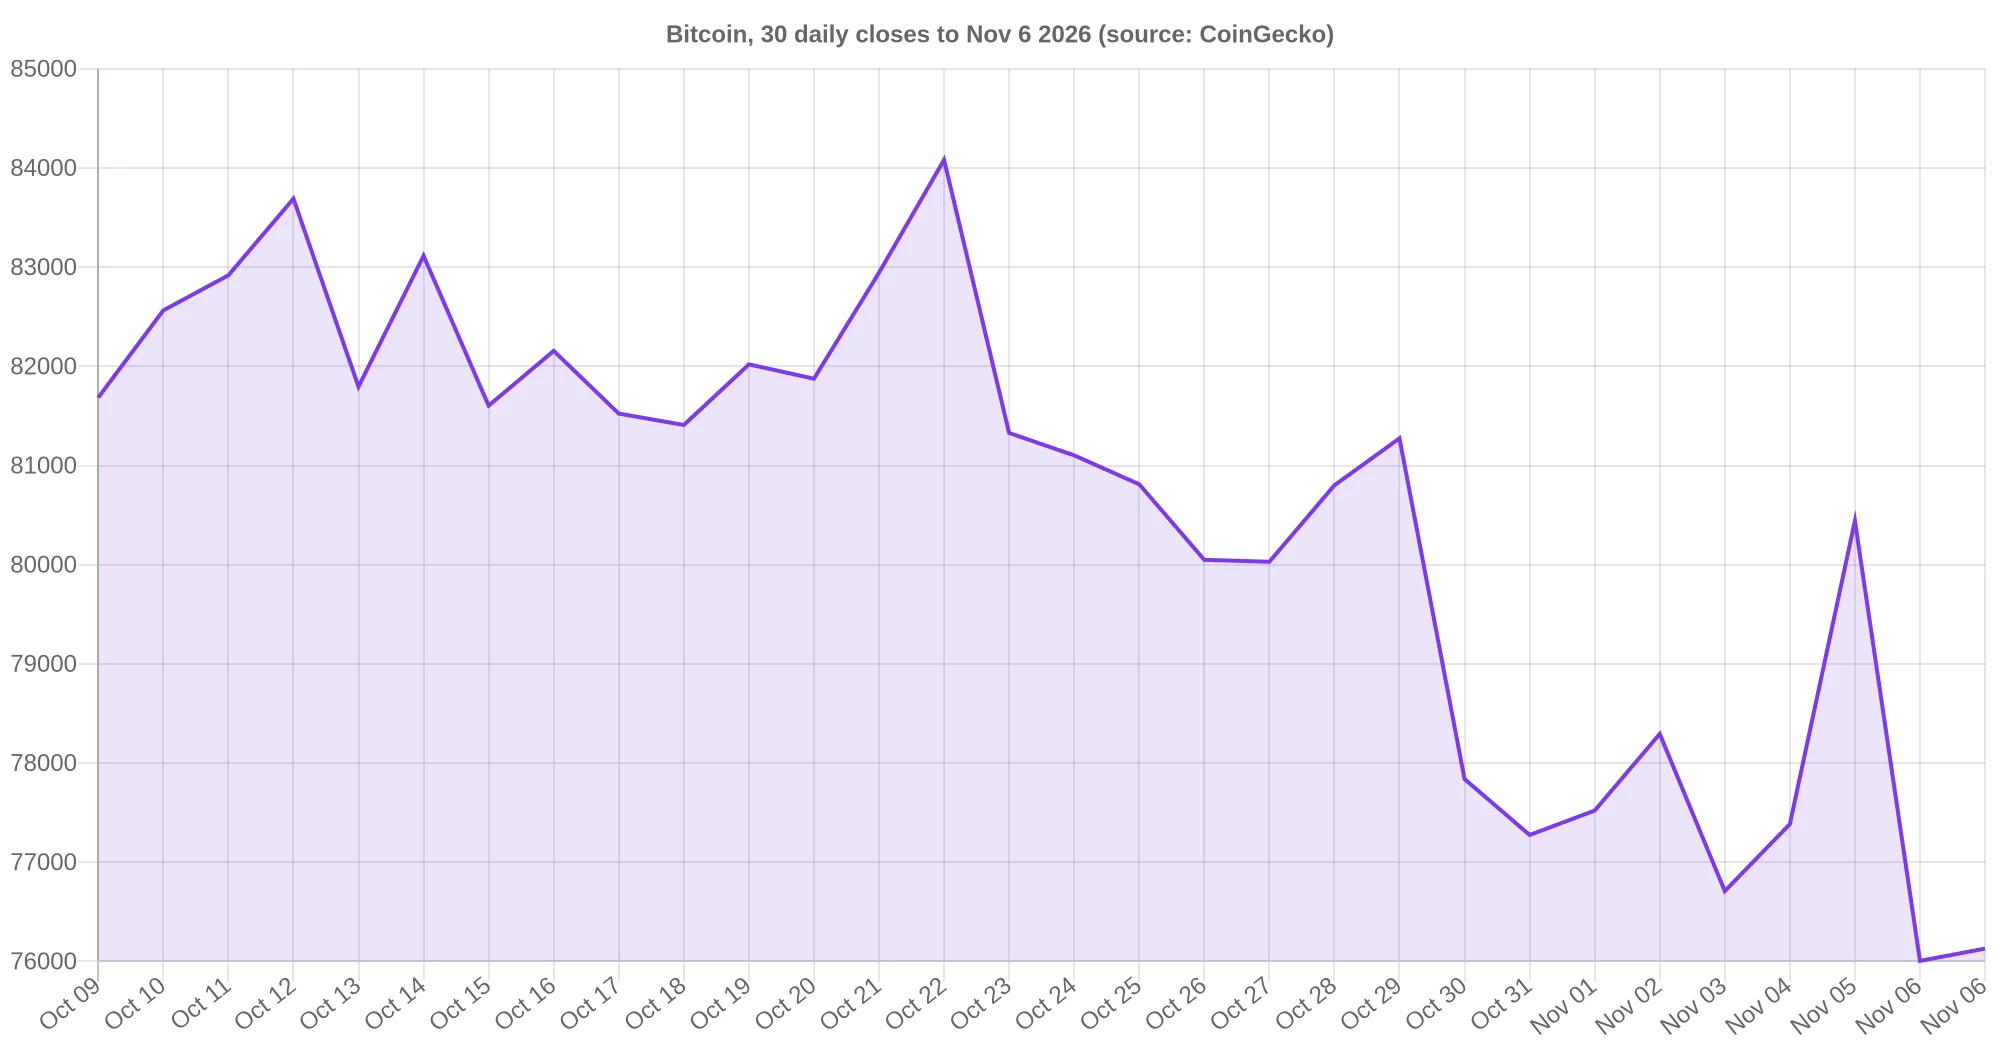
Everything below is conditional, on a daily UTC close, because intraday wicks through a 30-day low have been the norm rather than the exception in this range.
- $76,005 holds on a daily close. The flush stays a wick, and the 30-day range remains intact. This is the only price that makes a long position definable today, because the stop sits $118 away from spot.
- $79,696 is reclaimed on a daily close. That is the 20-day average, and it would put price back above the level where most of October’s buyers are whole. Until then every bounce is a bounce inside a downtrend.
- $76,005 breaks on a daily close. The read flips. The 30-day range is gone, there is no closing support inside the measured window, and the “buy the flush” case loses its invalidation point rather than gaining a lower entry.
- $80,443 is recovered. That is the Nov 5 daily close, and reclaiming it would mean the flush was fully retraced rather than merely absorbed.
The prior leg lower into $82,000 had a different set of drivers and a different chart. Back then price was testing a shelf inside an established range. Now it is testing the bottom of that range, with the same moving averages stacked overhead.
What $76,000 Buys in Market-Cap Terms
At $76,123, Bitcoin’s market capitalisation is $1.53 trillion. Each 1% move in the price reprices that by about $15.3 billion, which is 1.8 times Chainlink’s entire $8.28 billion market cap, 57% of Chainlink and Hyperliquid combined at $26.96 billion, and about a twentieth of Ethereum’s $273.4 billion.
The doubling arithmetic is worth writing down because it disciplines the language. A 2x from here requires a $3.06 trillion market cap, or $152,259 per coin on today’s float. That is a statement about the size of the buyer required, not a forecast, and no liquidation print or ETF flow in this report changes it.
Relative scale also explains why capital rotates the way it does. Bitcoin is 5.6 times Ethereum’s $273.4 billion, and Zcash’s $21.79 billion is 1.4% of Bitcoin’s. On a day when the whole market sheds 6.5%, the difference between a large liquid asset and a small one is not direction. It is how much of your position you can exit without moving the print.
| Asset | Price (USD) | 24h change | Market cap | 24h volume |
|---|---|---|---|---|
| Bitcoin (BTC) | 76,123 | -5.25% | $1.530T | $45.08B |
| Ethereum (ETH) | 2,237.42 | -7.41% | $273.4B | $17.94B |
| Solana (SOL) | 90.07 | -6.88% | $53.2B | $3.71B |
| Zcash (ZEC) | 1,280.24 | -3.53% | $21.8B | $1.40B |
| Hyperliquid (HYPE) | 78.05 | -5.73% | $18.7B | $1.43B |
| Chainlink (LINK) | 10.80 | -6.60% | $8.3B | $364M |
Snapshot: CoinGecko, Nov 6 2026, 10:15 UTC. The total market stood at $2.58 trillion, down 6.49% in 24 hours, with Bitcoin dominance at 59.27%.
What Screens Best, and What Merely Fell Least
Three things separate the candidates on a day like this: how much they fell relative to the market, how deep their order book is, and whether the fall was forced or chosen.
Bitcoin wins on liquidity by a wide margin. Its $45.08 billion of 24-hour volume is 12.1 times Solana’s and 32 times Zcash’s, so a position can be sized and exited without the exit becoming the event. That is the practical argument for it being first on the list, and it has nothing to do with being the best-performing chart.
Zcash is the relative-strength hold. It fell 3.53% against a 6.49% decline in the total market, a 2.96 percentage point outperformance, and it now carries 0.84% of total market value. That is a real number and a thin one. Low beta in a deleveraging session often reflects a smaller, less leveraged holder base rather than fresh demand, and the same thinness that cushions a 5% down day amplifies a 15% one.
Ethereum is the laggard to leave alone until the ratio stabilises. ETH fell 7.41% against Bitcoin’s 5.25%, and the ETH/BTC ratio now sits at 0.0294, down 2.16 percentage points of relative performance in a day. Buying the weaker half of a pair while the ratio is still making lows is a bet on mean reversion with no confirmation.
For contrast, the previous instalment of this series, which flagged Injective’s rally on a Nasdaq ETF clearance , was built on an asset-specific approval. Today has no equivalent catalyst. The best available evidence is a liquidation book that has stopped accelerating and an ETF flow that has not.
The Triggers That Would Change the Read
Three observations would each shift the balance, and all three are scheduled rather than speculative.
First, the daily close. A settle above $79,696, the 20-day average, would say the flush was absorbed and the range survived. A settle below $76,005 would say the opposite, and would invalidate the stop that makes the current entry definable.
Second, the ETF print. Farside publishes the US spot Bitcoin ETF table after the session closes, around 21:00 UTC. A net inflow would break the four-negative-sessions-in-five pattern described above. A second consecutive outflow day above $400 million would confirm that the slow bid is still leaving while the fast one is being rebuilt.
Third, the composition of the next liquidation day. Longs took 88.1% of today’s total. If the next large print is dominated by shorts, the positioning that produced this flush has flipped, which is a different setup with different risk.
None of these is a reason to buy today. They are the conditions under which the answer to “best crypto to buy now” changes from a tight stop at $76,000 to something wider.
Frequently Asked Questions
Only with a defined risk. Bitcoin at $76,123 sits 4.5% below its 20-day average of $79,695.80 and 9.5% below its 30-day high, with the 30-day low of $76,005.51 close enough to use as a stop. A trader who cannot accept a stop near that level has no basis for the entry, because the same $1.26 billion liquidation print that created the discount can extend.
The proximate driver was forced deleveraging: $1.12 billion of long liquidations out of a $1.26 billion total over 24 hours, per CoinGlass. Spot Bitcoin ETFs had also recorded a $430.2 million net outflow on Nov 5, per Farside. Both facts are documented. Which one started the move, and how much of it came from the concurrent semiconductor selloff, is not established by the available data.
It is the value of leveraged futures positions closed by exchanges because margin ran out, not money that left crypto. CoinGlass counted 241,242 affected accounts in 24 hours, with Binance handling 45.2% of the total. The largest single order was a $10.94 million ETHUSDT long closed at $2,243.86.
Zcash, at $1,280.24 and down 3.53% in 24 hours against a 6.49% decline in total market value, a 2.96 percentage point outperformance. Bitcoin fell 5.25%, Solana 6.88%, Chainlink 6.60% and Ethereum 7.41%. Relative strength of that kind often reflects a thinner, less leveraged holder base rather than demand.
A daily close below $76,005.51, today’s low and the bottom of the 30-day range. Below that level there is no closing support inside the measured window, so the stop that defines the trade no longer exists. A daily close back above $79,695.80, the 20-day average, would confirm the flush was absorbed.