



Geopolitical instability, institutional hedging, and a lack of liquidity are creating conditions that could lead to a disastrous breakout, despite the market's seeming calm.
The cryptocurrency sector is buzzing with excitement right now. The global crypto market cap increased by 0.02% to $2.71 trillion over the weekend, a small change that belies the enormous pressures operating below the surface.
This is more of a pressure consolidation than a strength consolidation; the market is coiled so tightly that when it unwinds, it will reshape the near-term trajectory of digital assets like Bitcoin and Ethereum.
Instead of worrying about whether the equilibrium will fall, market players should focus on where the pieces will fall.
A Market of Uneasy Equilibriums
An intriguing variety of contrasts characterize the current state of the market.
Despite the statistics from derivatives indicating a need for prudence, institutional interest in ETFs demonstrates a strong sense of trust.
There may be a relief bounce in the market if geopolitical tensions are reduced, but long-term growth is difficult to achieve due to oil and inflation-related macroeconomic issues.
There is a lack of liquidity at the moment; the market cap is approaching critical support levels, and the structure as a whole seems to be quite fragile.
There will be a breakout, but it's not apparent which way it will go.
Now is not the time for blind faith, but for vigilant monitoring and calculated risk mitigation.
According to cryptocurrency specialist Michaël van de Poppe, who expressed optimism, Bitcoin might soon hit $90,000 and Ethereum could surpass the $3,000 barrier.
I wouldn't be surprised if;
— Michaël van de Poppe (@CryptoMichNL) September 6, 2026
- $NEAR runs to $5
- $LINK runs to $20
- $SUI runs to $2
- sei-network:native runs to $0.15
- $ETH goes to $3,000+
- bitcoin:native hits $90,000
Those are all relatively easy to hit in the coming period, as long as Bitcoin consolidates.
Although some industry insiders have called the $90,000 target price for Bitcoin "relatively easy," the existing data suggests that the consolidation that is necessary to reach that goal may be unstable.
The Institutional Pivot and the Fragile Basis
Re-engagement from major institutions is the most noteworthy development this past week, but there is more complexity to the narrative than meets the eye.
A part of the market has strongly endorsed spot Bitcoin ETFs , which have garnered about $1 billion this week, indicating a substantial comeback in institutional interest.
Net inflows last week were $924.5 million, up from $924.5 million the week prior, according to SoSoValue data.
With a net inflow of $691.5 million for the week ending September 4, BlackRock's IBIT was the most lucrative fund.
Last week, the funds' trading volume was $14.5 billion, down from over $19 billion the week before.
The establishment of a healthy foundation is being signaled by this influx of capital and significant spot trading volumes.
Derivatives market data, however, strongly contradicts this story.
According to Coinglass's data, financing rates have gone negative and are still quite low, even though open interest is going up. There are major worries about this combo.
The market is showing signs of being quite cautious right now.
Although the derivatives market does not indicate a robust optimistic mood, institutional capital is pouring into the regulated, spot-based ETF channel.
The market structure is extremely vulnerable to a sudden squeeze in either direction since traders are reestablishing their holdings without taking a clear position.
Rapid and dramatic price changes that benefit only the most nimble traders may occur if volatility suddenly spikes, setting off a domino effect of liquidations.
Leverage and a lack of immediate liquidity make this market unfit for sustained trending prices.
Ethereum: Bullish Exception in a Sea of Red
If you are hoping to profit from future market fluctuations, you should take heart from Ethereum's resiliency, even though Bitcoin, XRP, and Dogecoin have all taken a tumble.
Market watchers are keeping a careful eye on ETH as it has been settling between the $2,460 and $2,525 levels, hoping for a possible breakout.
ETHEREUM READY FOR $2,700
— Ali Charts (@alicharts) September 6, 2026
Ethereum has been consolidating between $2,370 and $2,530 since August 26, building momentum for its next move.
The breakout direction will be confirmed by an hourly close outside this range, but the current structure favors the bulls.
A decisive move… pic.twitter.com/2B5pwzc9CN
If Ethereum wants to break the $3,000 barrier, the market dynamics will have to change drastically.
Market players are paying close attention to these levels since they are seen as a crucial technical junction that will dictate the next big move.
Because of the general market uncertainty, Ethereum's upward momentum will probably be limited if Bitcoin keeps struggling.
XRP and DOGE: Trapped in the Alpha's Shadow
Altcoins like XRP and Dogecoin have taken a particularly hard hit from the general public's fear of taking risks.
Both are losing money, and how Bitcoin does will determine their fate.
Achieving a continuous climb past the 50-day and 200-day moving averages is a crucial milestone for XRP , but it has faced substantial opposition on its way there.
The cryptocurrency can face more selling pressure if support around $1.30 breaks. At this pivotal juncture, Dogecoin's future growth prospects are highly dependent on the good trends created by Bitcoin and Ethereum.
Geopolitics: A Market Catalyst and a Structural Barrier
There is a direct correlation between the ongoing geopolitical standoff between Iran and the present market standstill.
Even while traders are taking into consideration the likelihood of a resolution, the failed conversations pose a substantial hurdle to a more hopeful market outlook.
Rather than reacting to actual results, the market is focusing on headlines and speculation right now.
This circumstance is typical of how speculation creates initial euphoria, which might lead to a big rebound if diplomatic efforts are successful.
Nevertheless, it is important to carefully assess whether these advantages can be sustained.
Publicly expressing doubt about a nuclear deal by Energy Secretary Chris Wright - implying a US preference for the "degradation" of Iran's nuclear capabilities - only serves to heighten the already prevalent sense of unpredictability.
When it comes to cryptocurrency, geopolitical unpredictability affects energy prices, which in turn affects inflation expectations and interest rate decisions made by monetary policymakers.
Despite a temporary calm in the Middle East, this underlying macroeconomic weakness would remain.
BTC's Technical Crossroads: Low Momentum, High Stakes
Bitcoin is trading just under $80,000 , and the fact that it is trading inside a decreasing consolidation range suggests that a directional breakout may be imminent.
There is a fundamental paradox in the market right now: a bullish framework for the long term and momentum fatigue for the short term.
Despite Bitcoin's continued resistance above key moving averages - including the 50-week simple moving average (SMA) at around $80,350, a key technical level that has traditionally signaled the end of four out of five bear markets - the present indications are cautious.
In a positive light, the framework remains stable.
A traditional uptrend is confirmed by a succession of higher highs and higher lows on both the daily and weekly charts.
Positioned well below the current price, the 200-period SMA stands at around $69,700, indicating that the overall trend is positive.
Moreover, after last week's unexpected employment report, the range of $78,500 to $78,600 was tested and sustained, solidifying its position as a strong support level.
Assuming it holds, the bull flag pattern that started around $80,000 might lead to a price surge to $82,800–83,000 if it is confirmed. Indicators that point to a decline in momentum are becoming more prominent.
Equally serious are the warnings.
As price keeps making higher highs while momentum levels down, a common indicator of exhaustion, the MACD shows a bearish divergence on the daily chart.
Any breakout over $82,178 could be a false move, or "bull trap," due to the paucity of follow-through confidence, as the ADX reading of 15.2 indicates a noticeably weak trend strength.
On the 4-hour chart, we can see a divergence in MACD, suggesting that the positive momentum is waning, while the RSI is approaching overbought levels above 70.
All eyes will be on Wednesday's US CPI numbers as they shape the market narrative for next week.
If inflation data turns out better than expected, it would reignite hopes for interest rate cuts, which would propel the market to keep moving beyond $82,000.
Conversely, if numbers are higher, it would put pressure on risk assets, which could cause a drop to $78,500 or even $76,200.
Volatility is the only sure thing this week due to traders' gloomy outlook and prevalent "greed," which might lead to a squeeze in either direction of the market.
What Other Technical Readings Show
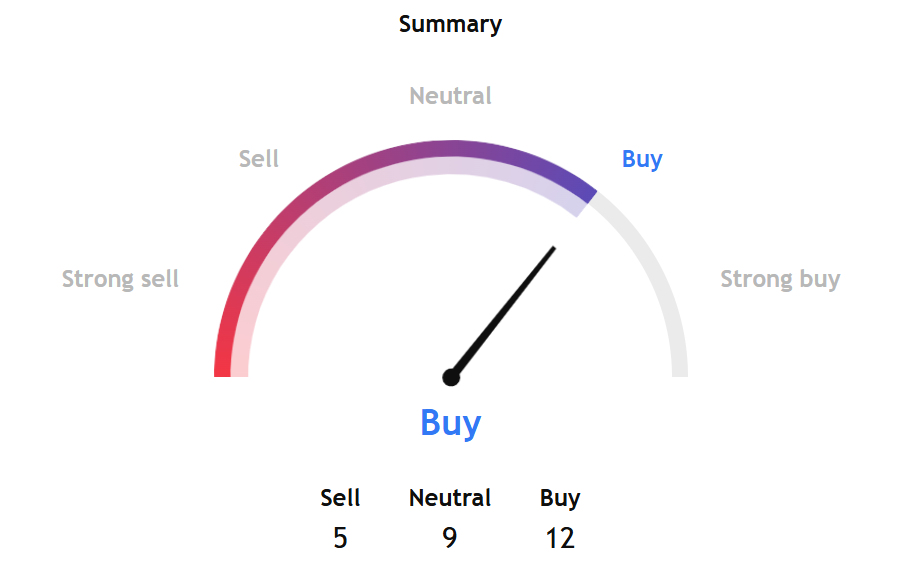
TradingView's technical analysis overview for the week ahead, based on key data from moving averages, oscillators, and pivots, points to a buy signal.
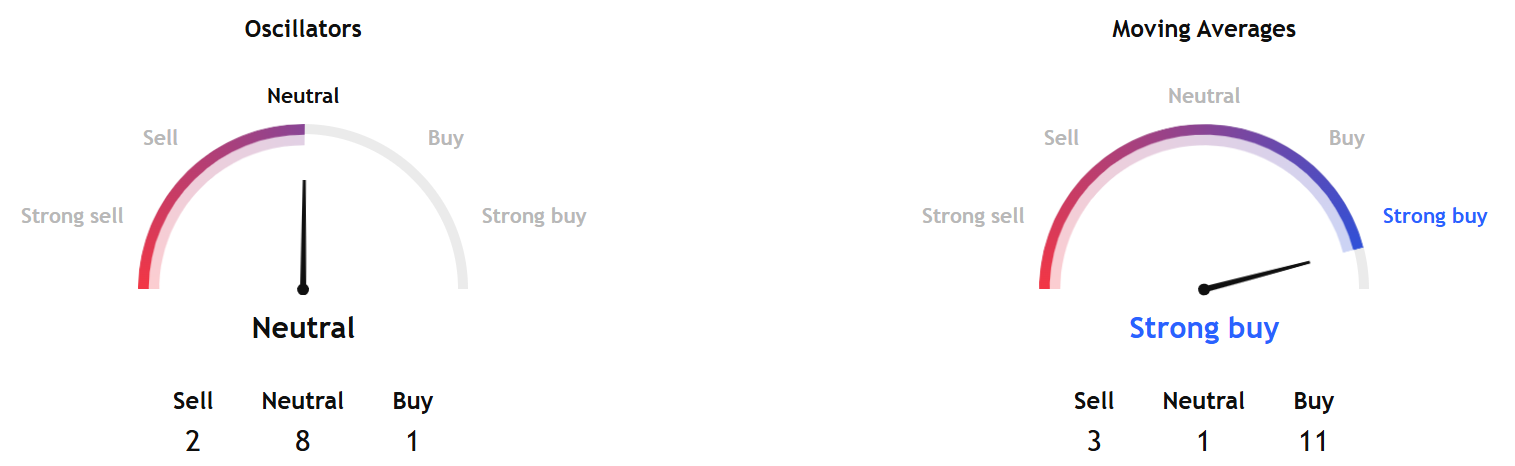
However, the short-term sub-gauges point to a neutral stance, even as long-term indicators show a buy signal.
Separately, InvestTech's Algorithmic Overall Analysis and one- to six-week recommendation showed a positive score.
The research said, "Investors have paid higher prices over time to buy Bitcoin, and the currency is in a rising trend channel in the short term. Rising trends indicate that the currency experiences positive development and that buy interest among investors is increasing. There is no resistance in the price chart, and a further rise is indicated. In case of a negative reaction, the currency has support at approximately $77,500."
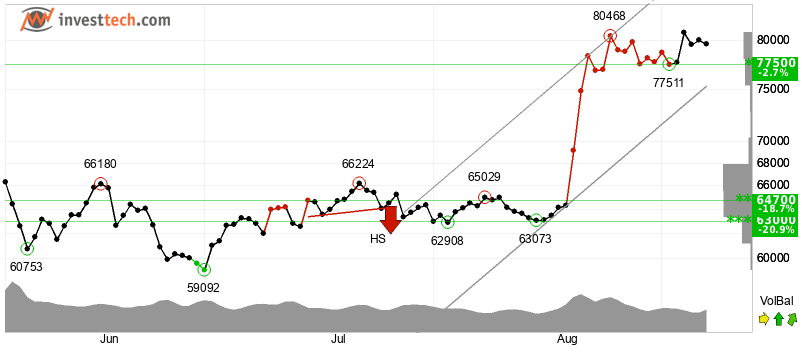
InvestTech added, "Positive volume balance, with high volume on days of rising prices and low volume on days of falling prices, strengthens the currency in the short term. The currency is overall assessed as technically positive for the short term."