Bitcoin Price Wobbles — Is A Sharp Downside Move On The Horizon?


Bitcoin price is struggling to settle above $113,500 and $114,000. BTC is now consolidating and might start another decline below $110,000.
- Bitcoin started a fresh decline after it failed to clear the $114,000 resistance level.
- The price is trading below $113,000 and the 100 hourly Simple moving average.
- There is a bearish trend line forming with resistance at $112,000 on the hourly chart of the BTC/USD pair (data feed from Kraken).
- The pair might continue to move down if it trades below the $110,200 zone.
Bitcoin Price Faces Hurdles
Bitcoin price started a recovery wave above the $112,500 resistance level. BTC recovered above the $112,800 and $113,000 resistance levels.
The price climbed above the 50% Fib retracement level of the recent decline from the $115,975 swing high to the $110,000 low. The bulls even pushed the price above the $113,500 resistance level. However, there are many hurdles on the upside.
Bitcoin is now trading below $113,000 and the 100 hourly Simple moving average. Besides, there is a bearish trend line forming with resistance at $112,000 on the hourly chart of the BTC/USD pair.
Immediate resistance on the upside is near the $112,000 level. The first key resistance is near the $113,000 level. The next resistance could be $113,700 and the 61.8% Fib retracement level of the recent decline from the $115,975 swing high to the $110,000 low.
A close above the $113,700 resistance might send the price further higher. In the stated case, the price could rise and test the $114,500 resistance. Any more gains might send the price toward the $115,250 level. The next barrier for the bulls could be $115,500.
Another Decline In BTC?
If Bitcoin fails to rise above the $113,000 resistance zone, it could start a fresh decline. Immediate support is near the $110,200 level. The first major support is near the $110,000 level.
The next support is now near the $109,500 zone. Any more losses might send the price toward the $108,500 support in the near term. The main support sits at $107,200, below which BTC might struggle to recover in the short term.
Technical indicators:
Hourly MACD – The MACD is now gaining pace in the bearish zone.
Hourly RSI (Relative Strength Index) – The RSI for BTC/USD is now below the 50 level.
Major Support Levels – $110,200, followed by $110,000.
Major Resistance Levels – $112,000 and $113,000.
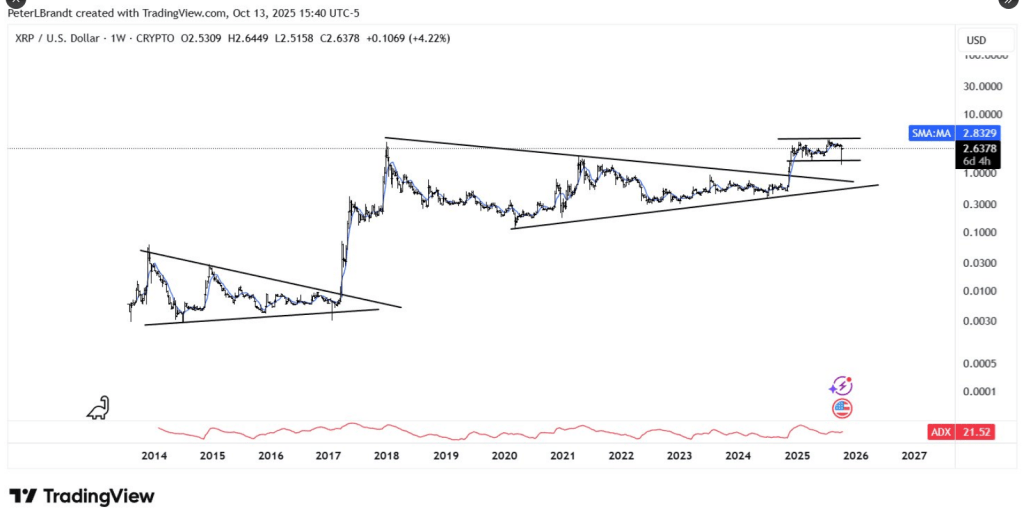
Ethereum Beware — Analyst Says XRP’s Next Bull Run Could Be Deadly
According to market charts and comments from well-known traders, XRP’s price action is drawing fresh...
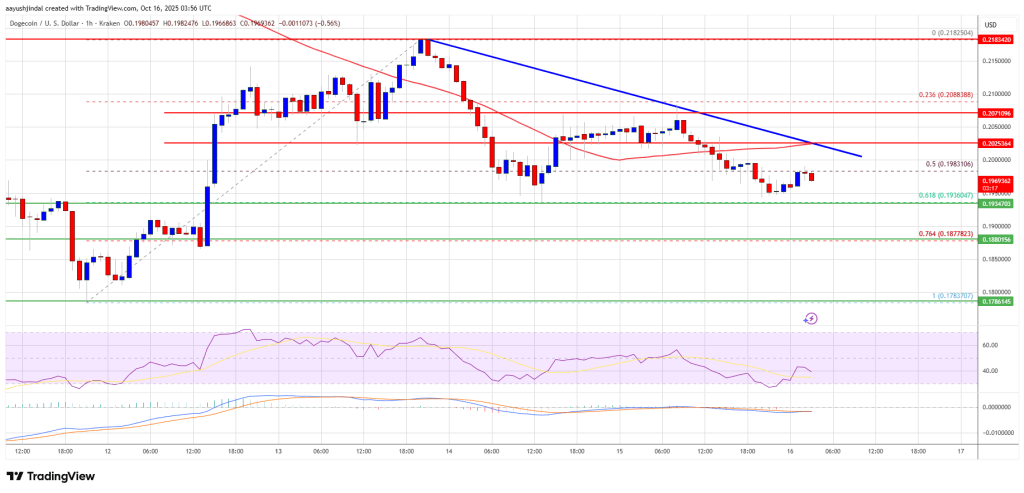
Dogecoin (DOGE) Bears Dominate — Price Action Suggests More Downside Ahead
Dogecoin struggled to rise above $0.2180 and corrected some gains against the US Dollar. DOGE is now...
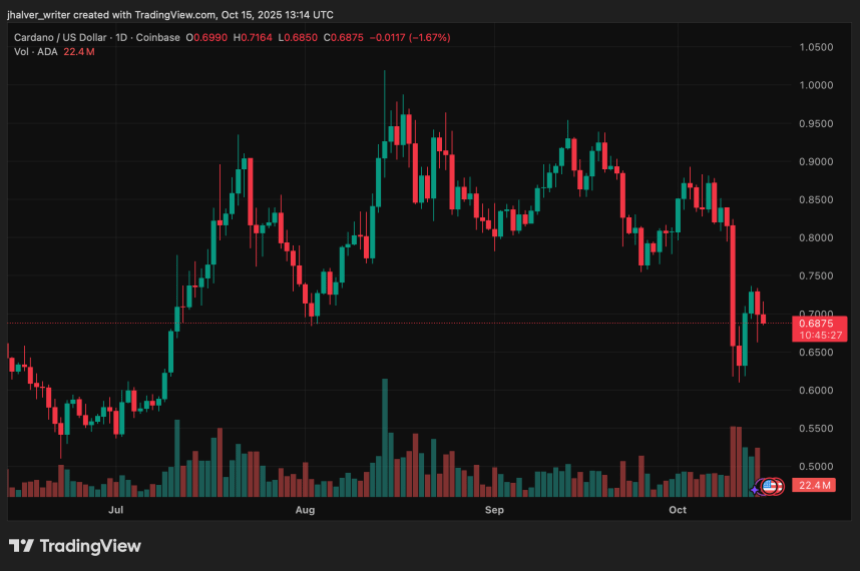
Cardano (ADA) Rebounds 2.2% to $0.70 as Whales Accumulate 200M Tokens Ahead of Berlin Summit
Cardano (ADA) edged higher to $0.70 (+2.2%) on Wednesday as on-chain data showed large holders buyin...