Dogecoin Cup and Handle Holds A Secret Few Are Seeing


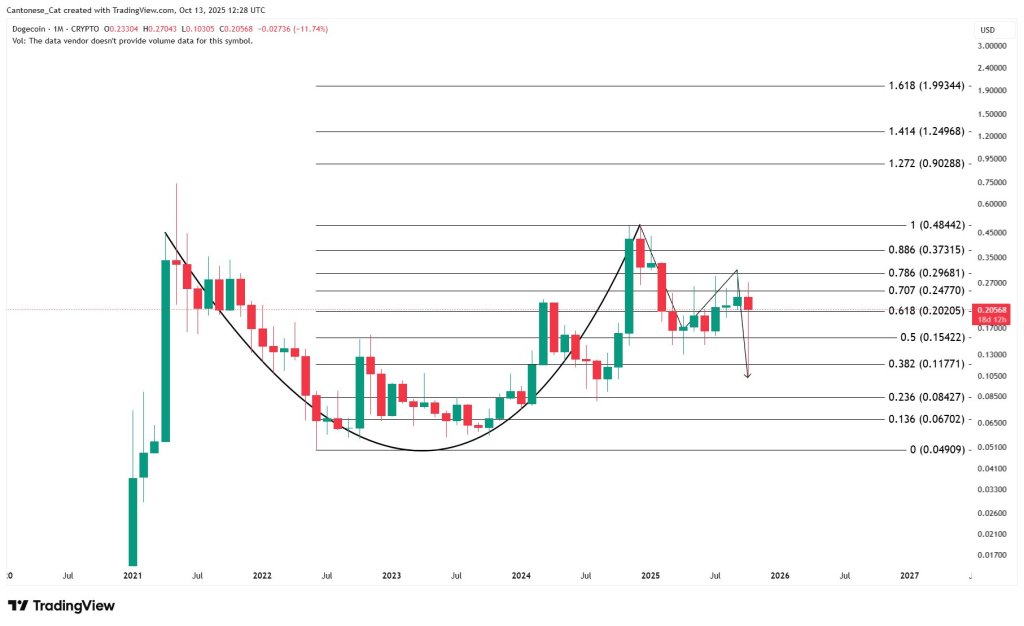
In a market shaken by liquidations and fear, one chart pattern on Dogecoin’s higher time frame continues to whisper a story most traders seem to be missing. According to crypto analyst Cantonese Cat, the monthly DOGE structure still forms the handle of a larger cup-and-handle formation that has been developing since 2021.
Dogecoin Cup and Handle Still Targets $2
Despite Friday’s sharp crash across altcoins, the analyst argues there’s “no technical damage.” His chart shows that the handle wick retraced as far as the 0.382 logarithmic Fibonacci level before rebounding to hold the 0.618 retracement as support, preserving the symmetry of the broader bullish setup that points toward the long-discussed $2 extension zone.
“This is a handle to the cup that wicked as far down as the 0.382 log fib but is currently holding 0.618 back as support. There is no technical damage in the greater scheme of things. Only emotional damage,” Cantonese Cat wrote via X.

The chart maps a rounded base from the 2021–2023 decline into a mid-2023–2024 upswing that peaked at the 1.000 Fibonacci marker at $0.48442 in December 202, thereby completing the “cup.”
Price has since carved the “handle,” with Friday’s crash extending below the 0.382 retracement at $0.11771 before recovering above the 0.618 at $0.20205. At the time of the snapshot, DOGE traded at $0.20568 on the monthly candle, down 11.74% for the period, with open, high, and low printed at $0.23304, $0.27043, and $0.10305, respectively.
The immediate inflection remains the 0.618 pivot near $0.20205; sustained acceptance above that shelf keeps the handle constructive. Overhead, the 0.707 and 0.786 retracements—$0.24770 and $0.29681—frame the next resistance band. A close through those levels would re-expose the prior swing zone around the 0.886 at $0.37315 and the 1.000 at $0.48442.
Cantonese Cat’s roadmap also includes standard Fibonacci extensions derived from the completed cup. The 1.272, 1.414, and 1.618 projections sit at $0.90288, $1.24968, and $1.99344, respectively. The latter aligns with the widely cited “$2” objective and is the technical anchor behind the analyst’s headline claim.
On the downside, the 0.500 at $0.15422 and 0.382 at $0.11771 mark the key retracement supports already stress-tested by the month’s wick; a decisive monthly close below 0.382 would compromise the handle symmetry, but that condition has not been met on the current candle.
Altcoin Momentum Also Still Intact
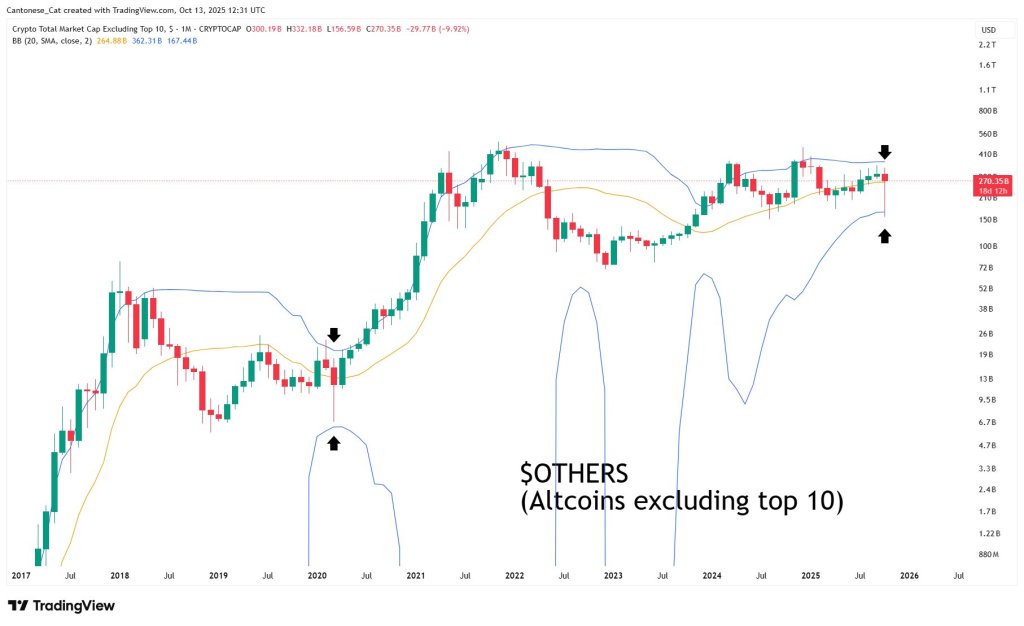
To contextualize last week’s washout across altcoins , the analyst published a second monthly chart of the “OTHERS” market-cap index (total crypto market cap excluding the top 10). The panel overlays 20-period Bollinger Bands and shows a classic squeeze preceding an abrupt spike in realized volatility.
According to the readout, the index opened the month near $300.19 billion, posting a high at $332.18 billion and a capitulation low at $156.59 billion before rebounding to $270.35 billion. Notably, that recovery carried back above the 20-month moving average—the Bollinger middle band—currently at $264.88 billion, after wicking to the lower band at $167.44 billion.
The upper band resides at $362.31 billion. Arrows on the chart highlight a near-identical pattern during the March 2020 COVID deleveraging: a monthly lower-band wick within a band squeeze that preceded a sustained upside cycle once the candle reclaimed the mid-band.

In commentary accompanying the charts, Cantonese Cat likened the weekend’s crypto drawdown to a“COVID-like deleveraging.” He wrote: “What happened this past weekend with altcoins is very similar to the deleveraging that happened in COVID based on technicals, with monthly Bollinger band squeeze and wicking down to lower Bollinger band. These moves are necessary for us to move up if the bull market is not over yet.”
He also pointed to US small-cap equities—via the Russell 2000 ETF (IWM)—as evidence of broader risk appetite, arguing that small caps’ V-shaped rebound from their own lower Bollinger Band and approach toward all-time highs helps explain why Bitcoin miners are outperforming spot cryptocurrencies. In his view, market-wide liquidity exists, but clearing excess leverage in altcoins was a precondition for the next leg higher.
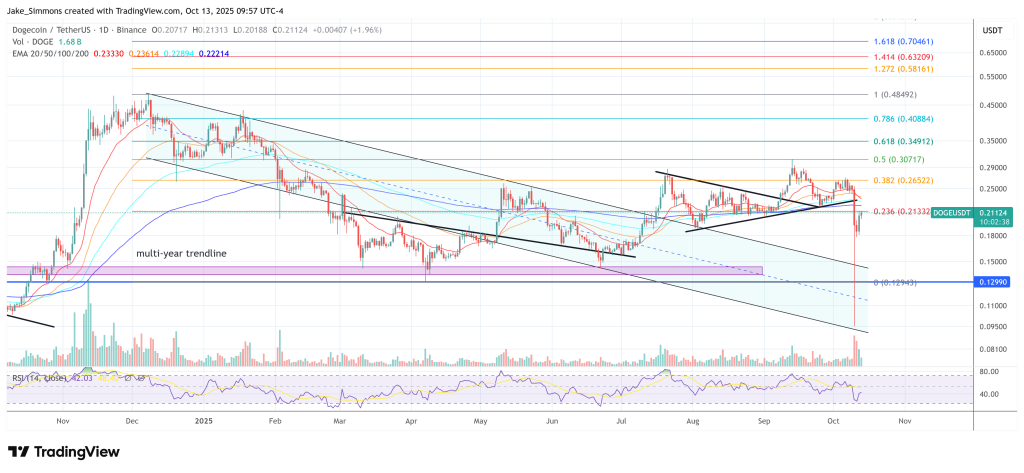
At press time, DOGE traded at $0.21124.


Solana Price Prediction: Analysts Expect $250 Recovery If Bitcoin Regains $120K
The digital asset market is shifting fast, and both Solana and Bitcoin are again in focus. Analysts ...

Solana Price Prediction: Analysts Expect $250 Recovery If Bitcoin Regains $120K
The digital asset market is shifting fast, and both Solana and Bitcoin are again in focus. Analysts ...

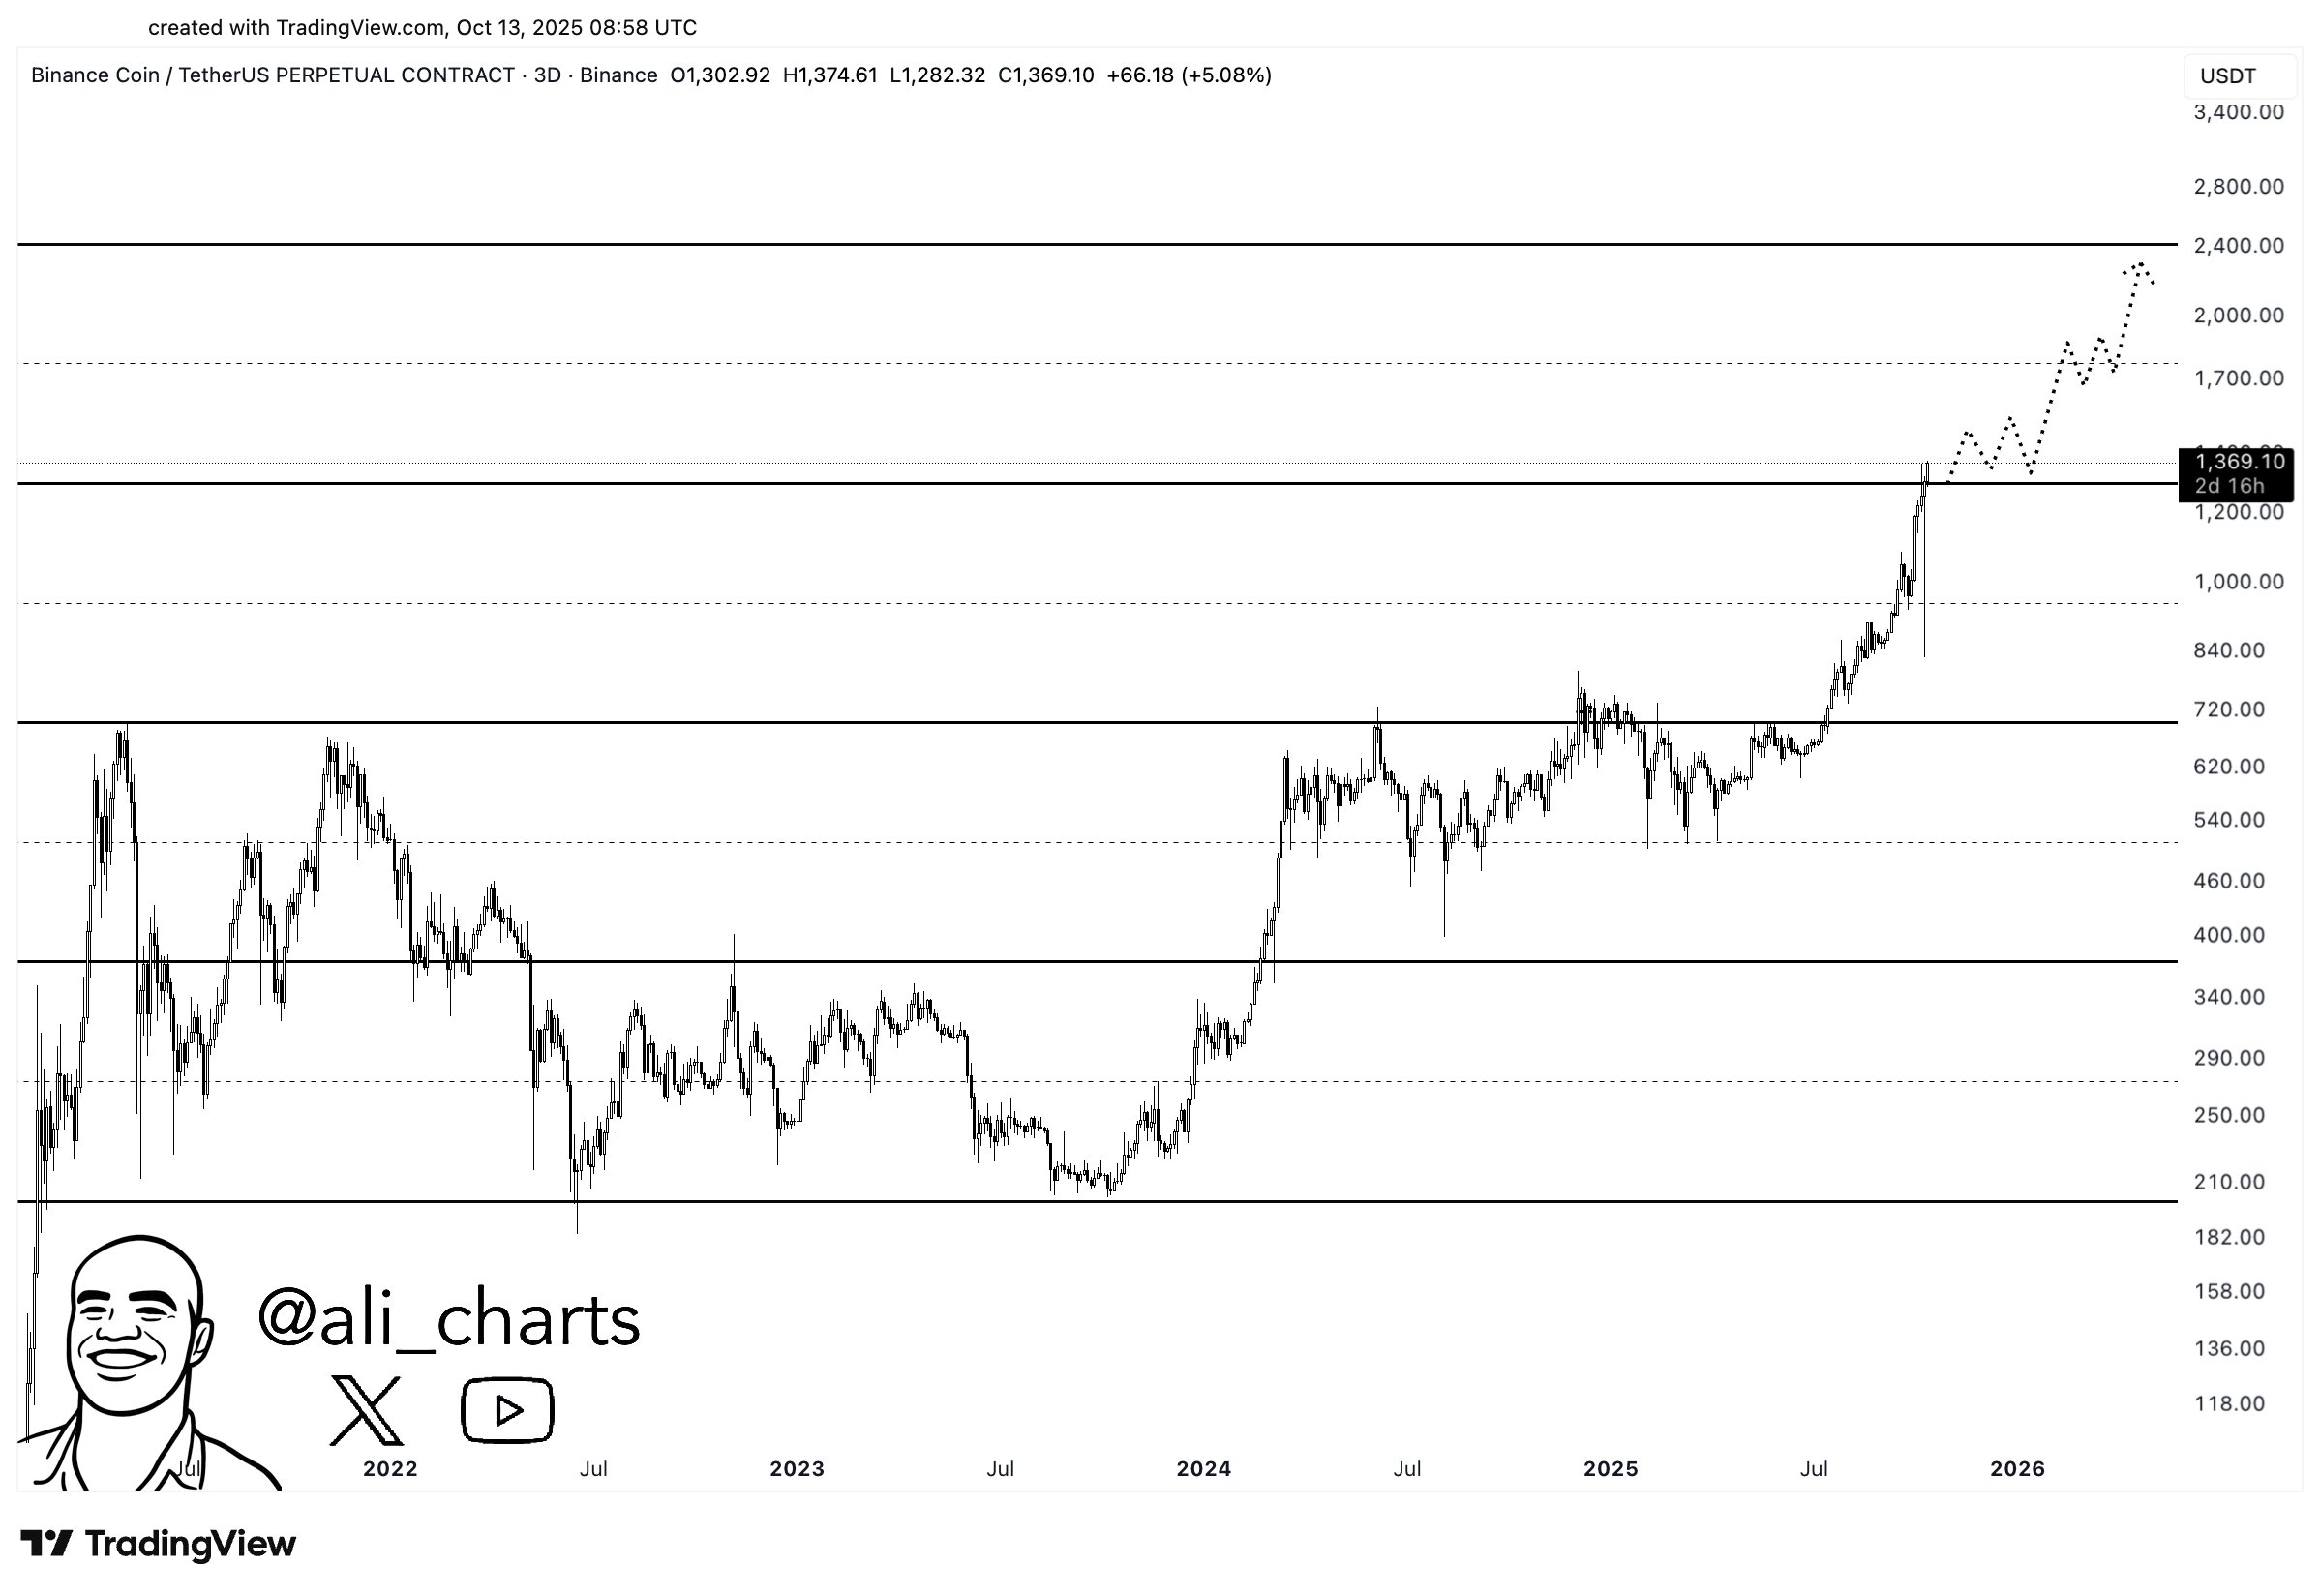
BNB Shoots Up 6%: Is This Just The Start Of A Run To $2,400?
BNB is back near $1,300 after a sharp rebound, but the asset may not be done yet as one analyst thin...

