Solana (SOL) Nosedives – Traders Fear More Pain Could Be Ahead


Solana started a fresh decline from the $232 zone. SOL price is now showing bearish signs and might even decline toward the $180 support.
- SOL price started a fresh decline below $232 and $220 against the US Dollar.
- The price is now trading below $200 and the 100-hourly simple moving average.
- There is a key bearish trend line forming with resistance at $204 on the hourly chart of the SOL/USD pair (data source from Kraken).
- The price could extend losses if it stays below $204 and $212.
Solana Price Dips Sharply
Solana price failed to stay above $232 and started a fresh decline, like Bitcoin and Ethereum . SOL traded below the $220 and $212 support levels to enter a bearish zone.
The bears even pushed the price below $200 and the 100-hourly simple moving average. A low was formed at $191 and the price is now consolidating losses below the 23.6% Fib retracement level of the downward move from the $242 swing high to the $191 low.
Solana is now trading below $200 and the 100-hourly simple moving average. Besides, there is a key bearish trend line forming with resistance at $204 on the hourly chart of the SOL/USD pair.
If there is a recovery wave, the price could face resistance near the $200 level. The next major resistance is near the $204 level or the trend line. The main resistance could be $215 or the 50% Fib retracement level of the downward move from the $242 swing high to the $191 low.
A successful close above the $215 resistance zone could set the pace for another steady increase. The next key resistance is $220. Any more gains might send the price toward the $232 level.
More Losses In SOL?
If SOL fails to rise above the $204 resistance, it could continue to move down. Initial support on the downside is near the $192 zone. The first major support is near the $188 level.
A break below the $188 level might send the price toward the $180 support zone. If there is a close below the $180 support, the price could decline toward the $174 support in the near term.
Technical Indicators
Hourly MACD – The MACD for SOL/USD is gaining pace in the bearish zone.
Hourly Hours RSI (Relative Strength Index) – The RSI for SOL/USD is below the 50 level.
Major Support Levels – $192 and $188.
Major Resistance Levels – $204 and $215.
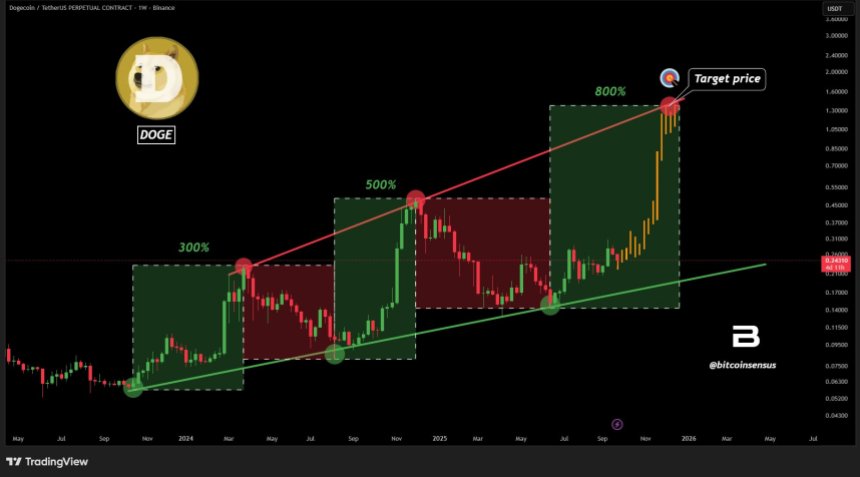
Dogecoin (DOGE) On The Brink Of A Major Breakout: 800% Rally In Sight
Dogecoin (DOGE), the leading memecoin in the cryptocurrency space, has faced significant challenges ...
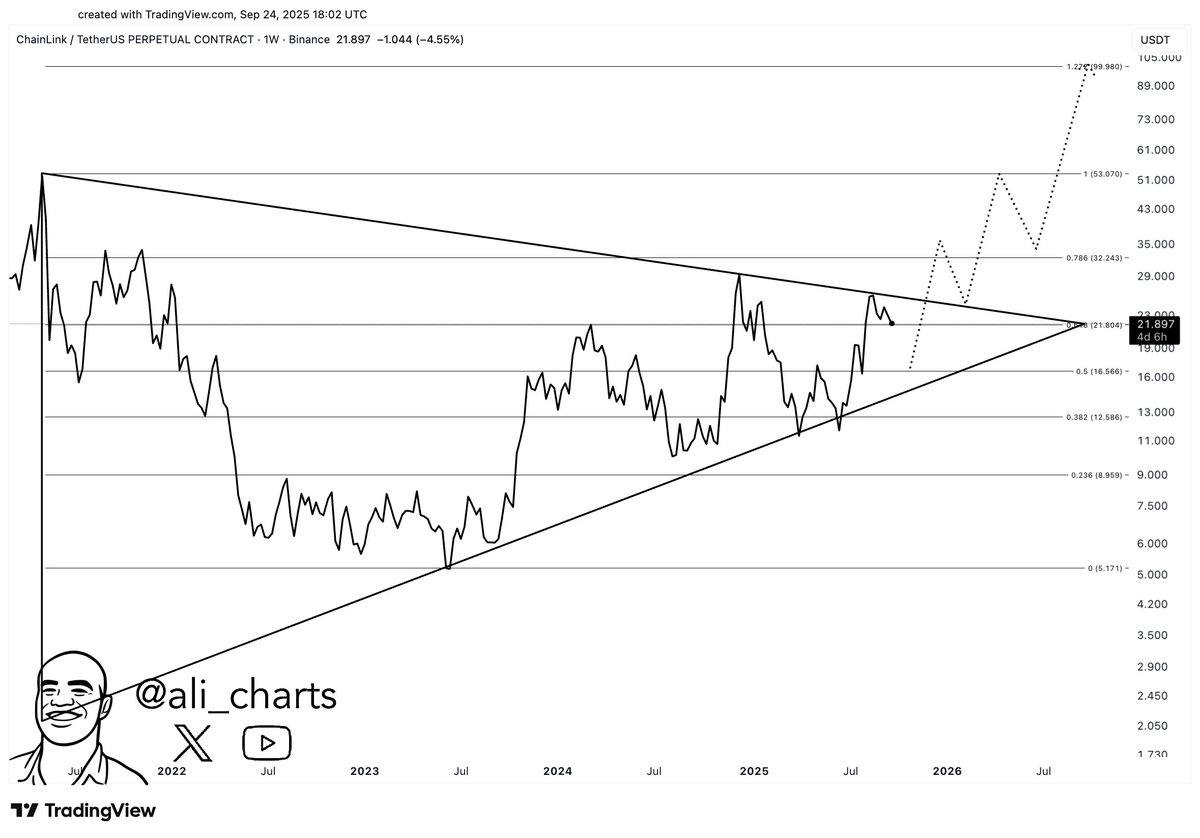
Chainlink (LINK) Triangle Setup Points To $100, Says Analyst
A cryptocurrency analyst has explained how a Chainlink triangle breakout setup could point to a mass...
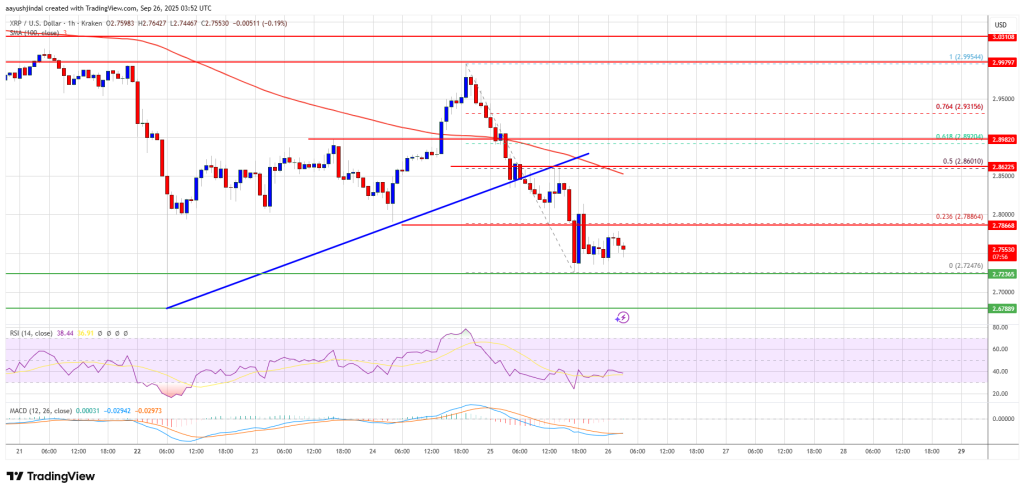
XRP Price Faces Pressure – Another Dip Raises Concerns Of Extended Decline
XRP price attempted a recovery wave above the $2.850 zone but failed. The price is again moving lowe...