Bitcoin Price Keeps Climbing – Are We Hours Away From a Major Breakout?


Bitcoin price is moving higher above $116,650. BTC is now facing hurdles and might extend gains if it clears the $118,000 resistance zone.
- Bitcoin started a fresh increase above the $116,500 zone.
- The price is trading below $116,500 and the 100 hourly Simple moving average.
- There is a key bullish trend line forming with support at $115,800 on the hourly chart of the BTC/USD pair (data feed from Kraken).
- The pair might start another increase if it clears the $117,850 zone.
Bitcoin Price Eyes More Gains
Bitcoin price started a fresh upward wave above the $116,000 zone. BTC managed to climb above the $116,200 and $116,500 resistance levels.
The bulls were able to push the price above $117,500. The price traded as high as $117,920 and recently started a downside correction. There was a move below the $117,200 level. The price dipped and tested the 50% Fib retracement level of the upward move from the $115,247 swing low to the $117,920 high.
However, the bulls were active near $116,750. Bitcoin is now trading above $116,500 and the 100 hourly Simple moving average . Besides, there is a key bullish trend line forming with support at $115,800 on the hourly chart of the BTC/USD pair.
Immediate resistance on the upside is near the $117,500 level. The first key resistance is near the $117,850 level. The next resistance could be $118,000. A close above the $118,000 resistance might send the price further higher. In the stated case, the price could rise and test the $118,500 resistance level. Any more gains might send the price toward the $118,800 level. The next barrier for the bulls could be $119,250.
Another Drop In BTC?
If Bitcoin fails to rise above the $117,850 resistance zone, it could start a fresh decline. Immediate support is near the $116,550 level. The first major support is near the $115,800 level or the trend line and the 76.4% Fib retracement level of the upward move from the $115,247 swing low to the $117,920 high.
The next support is now near the $115,250 zone. Any more losses might send the price toward the $114,500 support in the near term. The main support sits at $112,500, below which BTC might decline heavily.
Technical indicators:
Hourly MACD – The MACD is now losing pace in the bullish zone.
Hourly RSI (Relative Strength Index) – The RSI for BTC/USD is now above the 50 level.
Major Support Levels – $116,550, followed by $115,800.
Major Resistance Levels – $117,850 and $118,000.

Bitcoin Price Forecast: Expert Predicts 70% Chance Of New Highs Within Two Weeks
Following the recent decision by the US Federal Reserve (Fed) to cut interest rates, the Bitcoin pri...
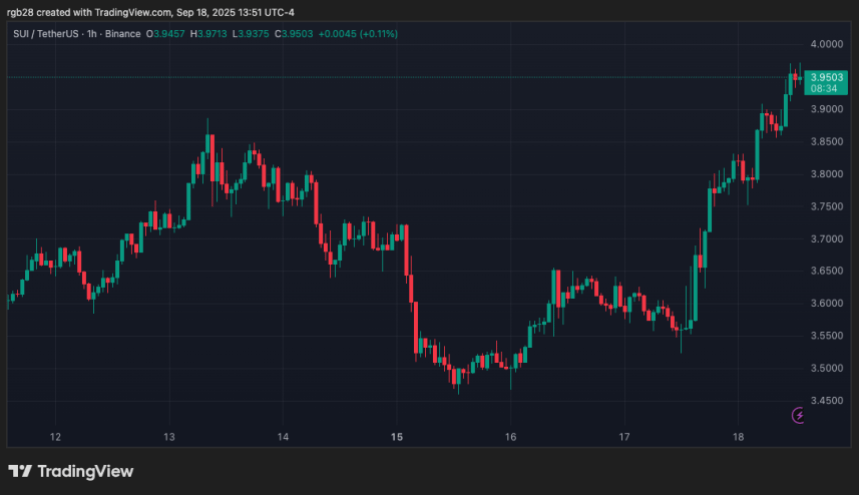
SUI Breakout In The Horizon? Price Eyes $4 Retest As Momentum Builds
SUI nears a crucial resistance level as intuitional momentum continues to grow and the network score...
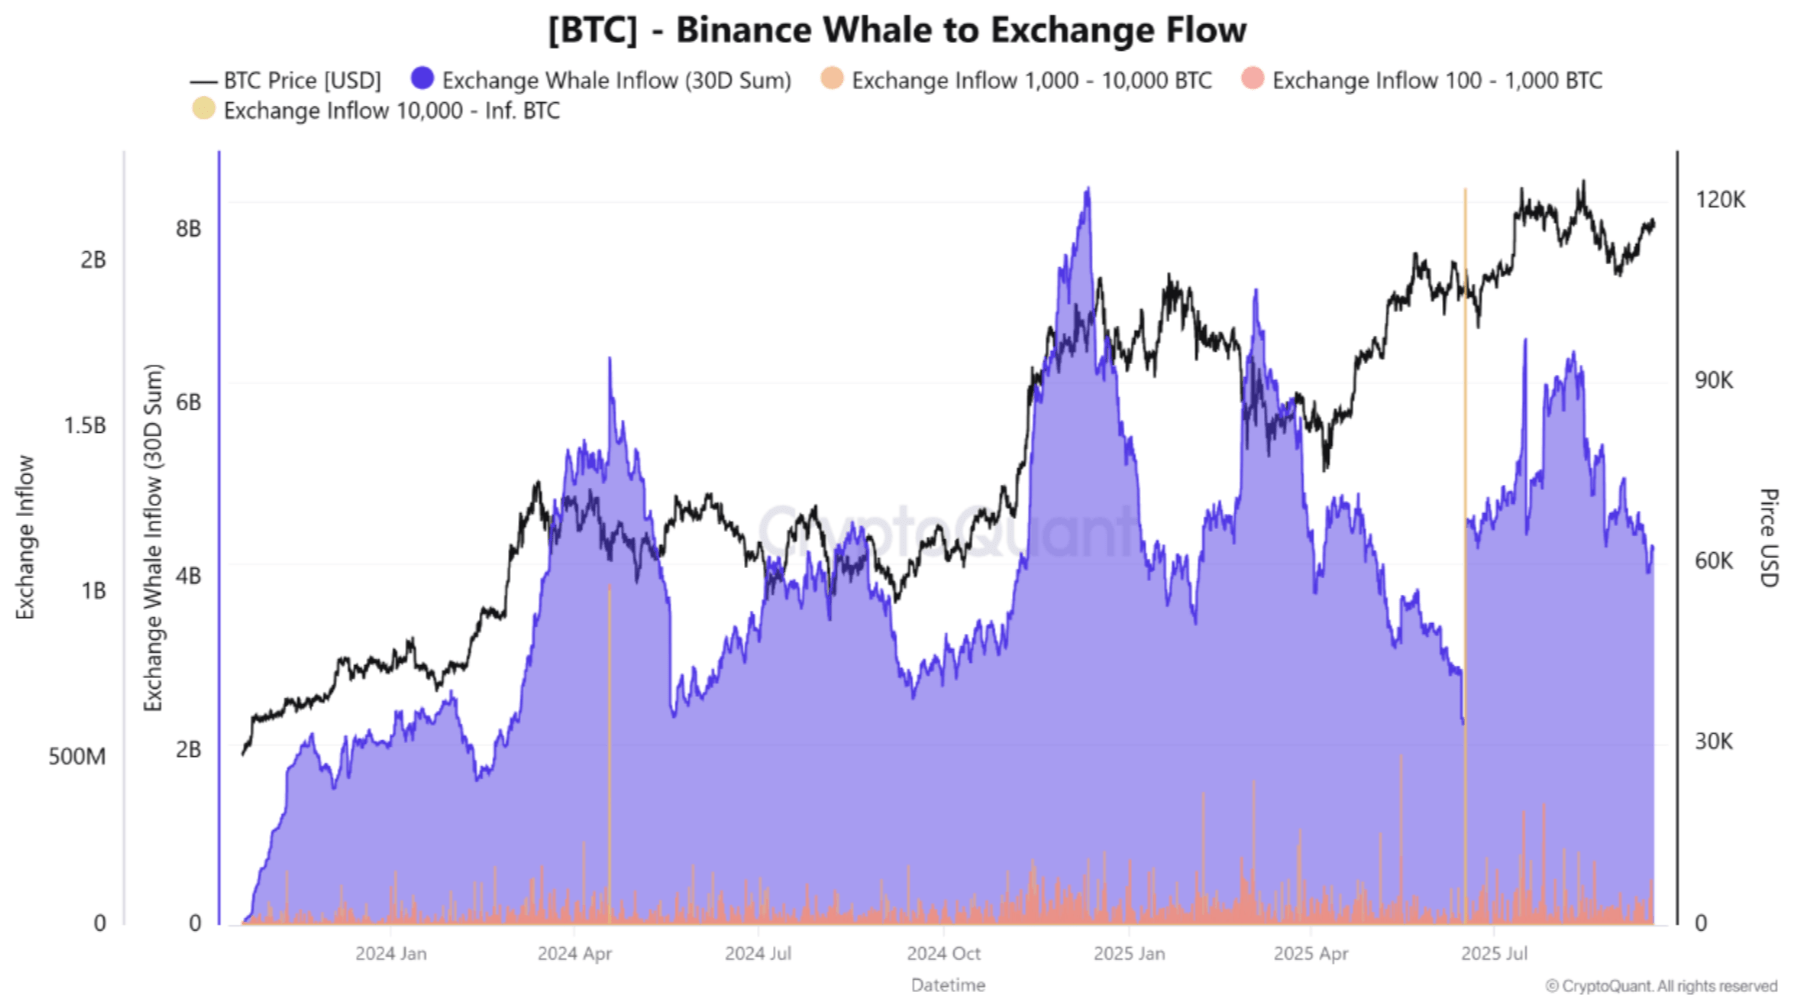
Bitcoin Holds $117,500 On Retail Support While Whales Stay Quiet – Cause For Concern?
Bitcoin (BTC) is holding near $117,500, up about 6.1% over the past two weeks. However, recent data ...