Solana (SOL) Corrects Some Gains – Is a Bigger Pullback Coming?


Solana started a fresh increase above the $232 zone. SOL price is now correcting gains below $240 and might aim for another increase if it stays above $20.
- SOL price started a fresh upward move above the $232 and $240 levels against the US Dollar.
- The price is now trading below $240 and the 100-hourly simple moving average.
- There was a break below a bullish trend line with support at $242 on the hourly chart of the SOL/USD pair (data source from Kraken).
- The pair could extend losses if it dips below the $230 zone.
Solana Price Dips Below Support
Solana price started a decent increase after it found support near the $212 zone, beating Bitcoin and Ethereum . SOL climbed above the $232 level to enter a short-term positive zone.
The price even smashed the $240 resistance. The bulls were able to push the price above the $245 barrier. A high was formed at $250 and the price recently corrected some gains. There was a move below the 23.6% Fib retracement level of the upward move from the $200 swing low to the $250 high.
Besides, there was a break below a bullish trend line with support at $242 on the hourly chart of the SOL/USD pair. Solana is now trading below $240 and the 100-hourly simple moving average.
On the upside, the price is facing resistance near the $238 level. The next major resistance is near the $240 level. The main resistance could be $245. A successful close above the $245 resistance zone could set the pace for another steady increase. The next key resistance is $255. Any more gains might send the price toward the $262 level.
More Losses In SOL?
If SOL fails to rise above the $240 resistance, it could start another decline. Initial support on the downside is near the $232 zone. The first major support is near the $230 level or the 50% Fib retracement level of the upward move from the $200 swing low to the $250 high.
A break below the $230 level might send the price toward the $224 support zone. If there is a close below the $224 support, the price could decline toward the $220 support in the near term.
Technical Indicators
Hourly MACD – The MACD for SOL/USD is losing pace in the bullish zone.
Hourly Hours RSI (Relative Strength Index) – The RSI for SOL/USD is below the 50 level.
Major Support Levels – $230 and $224.
Major Resistance Levels – $240 and $245.
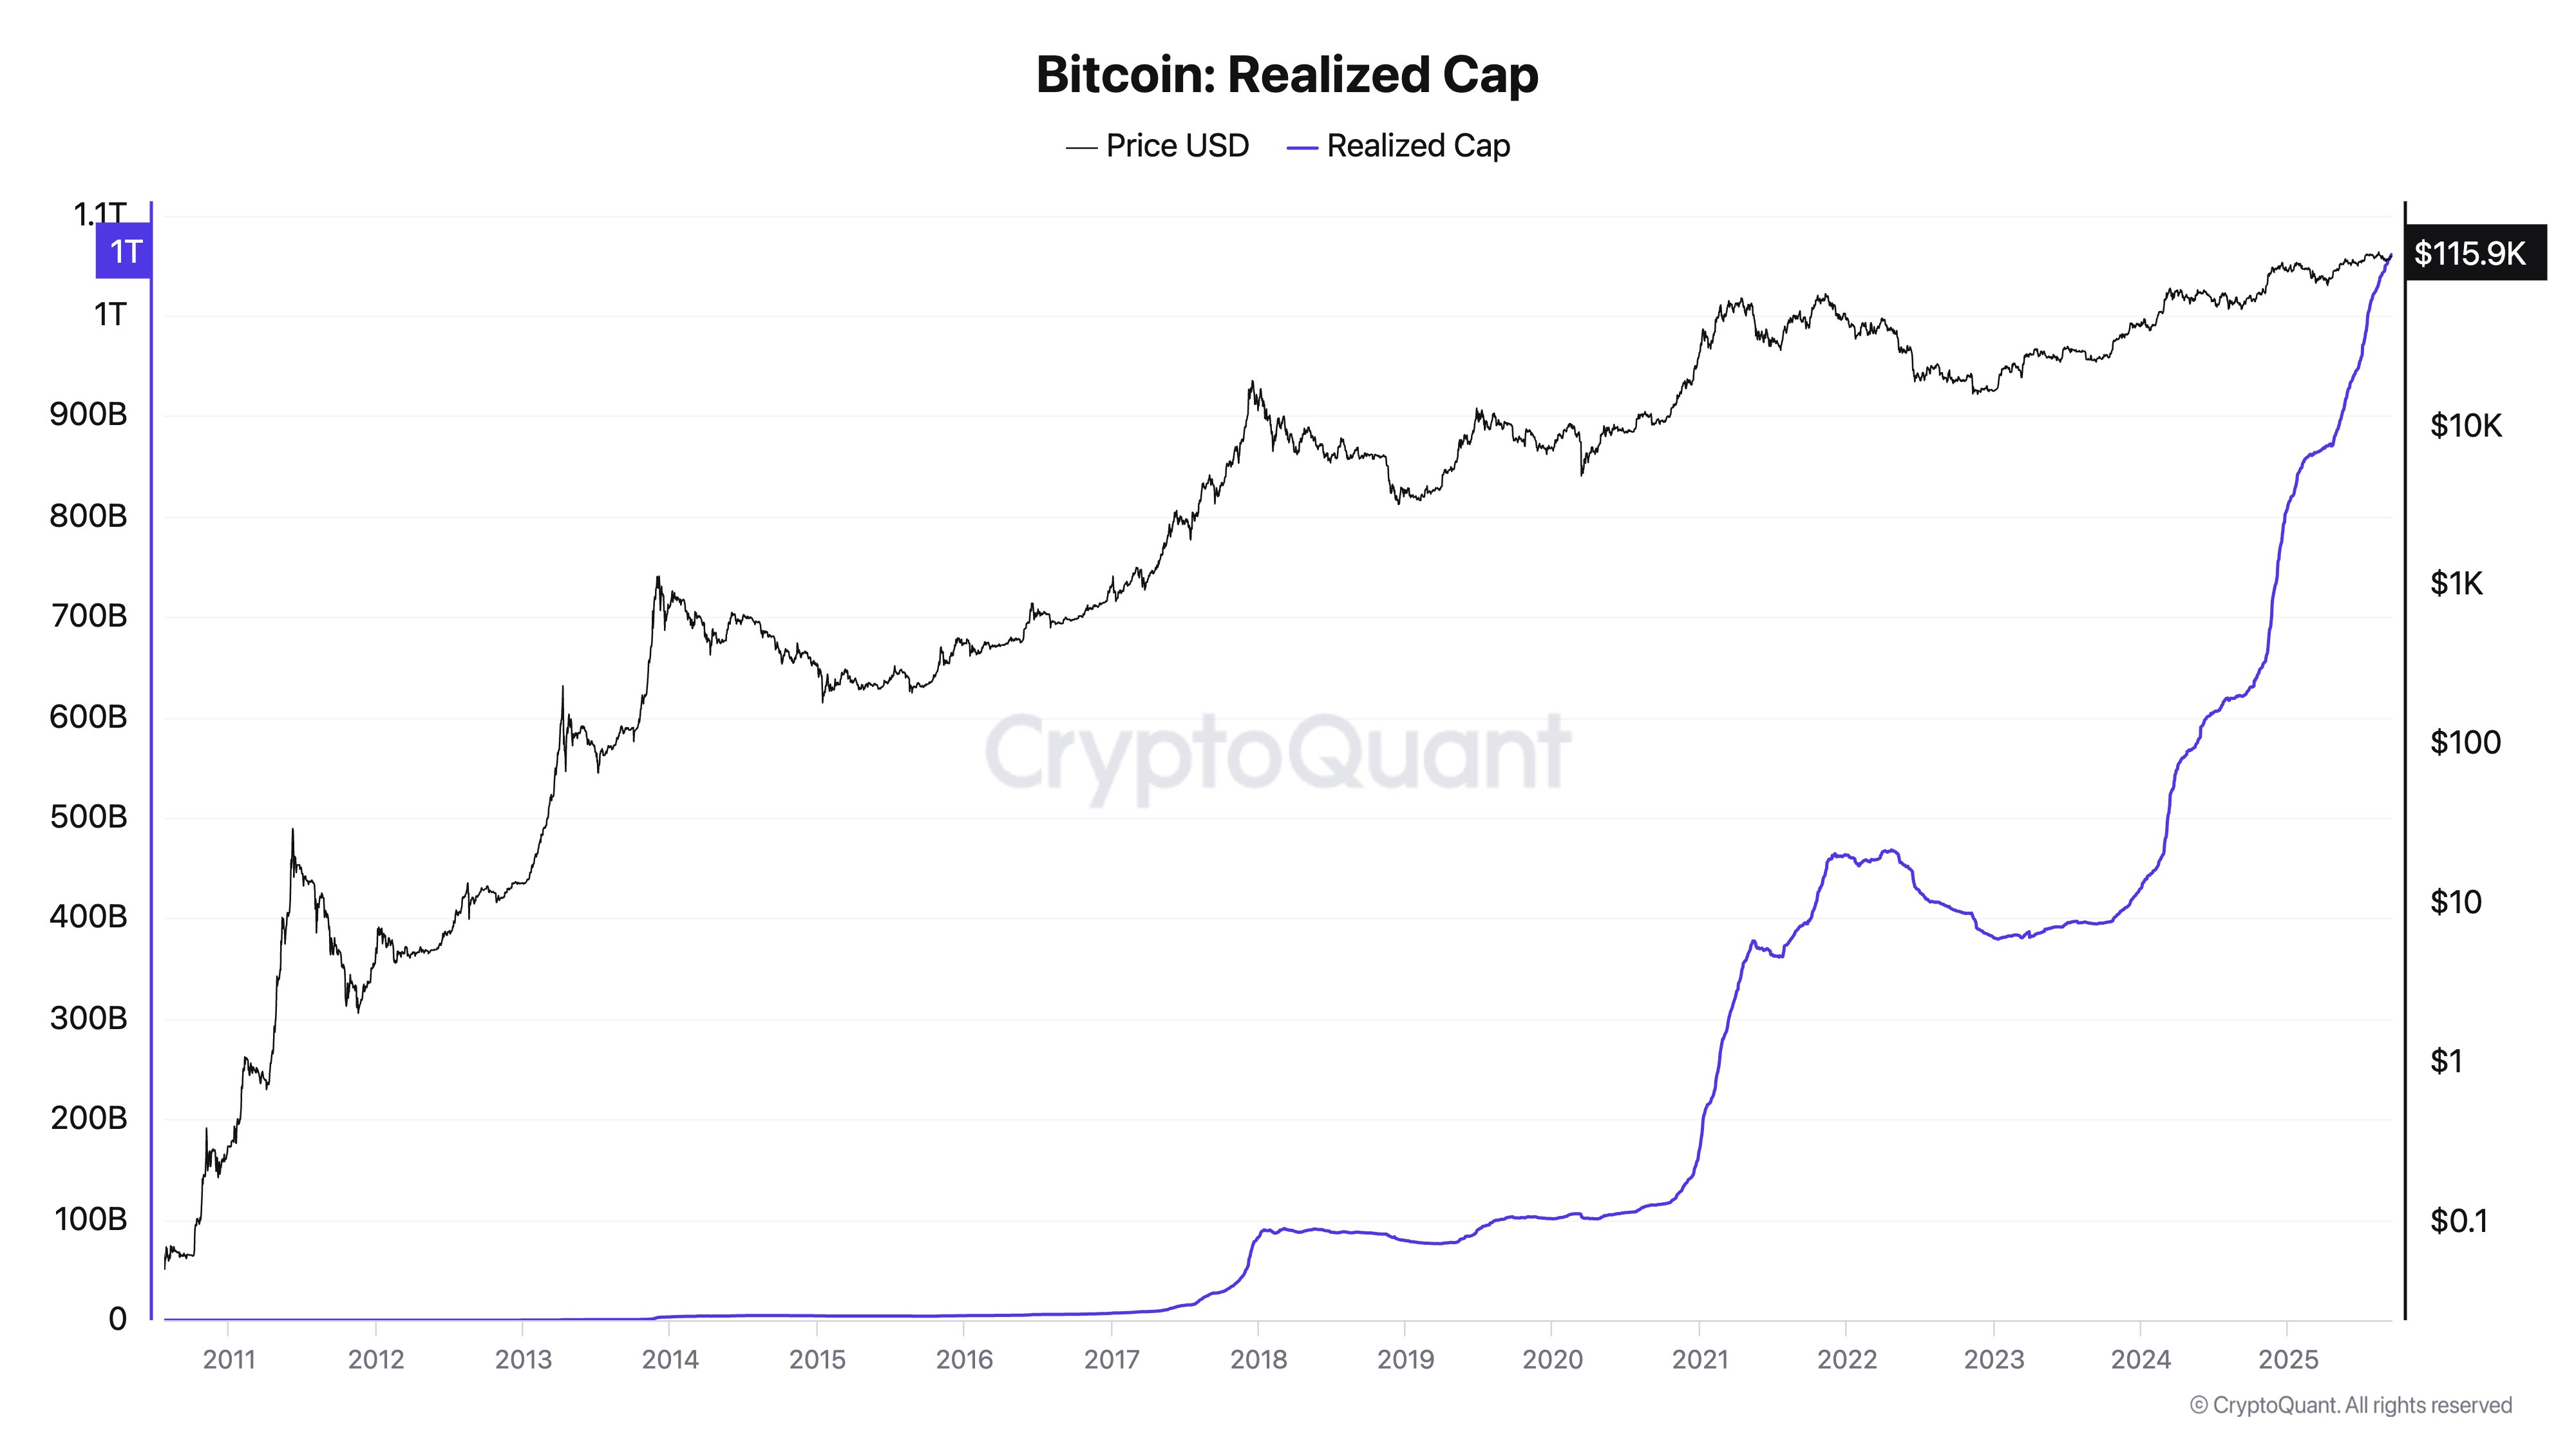
Bitcoin Inflows In Last 1.5 Years Surpassed First 15 Years Combined: Data
On-chain data shows inflows into Bitcoin have recently been so large that they outweigh the cumulati...
Analyst Raises Red Flags On Bitcoin Price: Allegations Of Market Manipulation
As investor anxiety grows over the possibility of a new bearish cycle, the case for Bitcoin (BTC) to...

Helius Joins Solana Treasury Trend With $500 Million Funding For New DAT Strategy
Nasdaq-listed firm Helius Medical Technologies Inc. unveiled the launch of a $500 million Solana-foc...