Solana (SOL) Stays Strong – Can Bulls Fuel the Next Breakout?


Solana started a fresh increase above the $215 zone. SOL price is now consolidating above $212 and might aim for more gains above the $220 zone.
- SOL price started a fresh upward move above the $205 and $212 levels against the US Dollar.
- The price is now trading above $212 and the 100-hourly simple moving average.
- There is a bullish trend line forming with support at $216 on the hourly chart of the SOL/USD pair (data source from Kraken).
- The pair could extend gains if it clears the $220 resistance zone.
Solana Price Eyes Upside Break
Solana price started a decent increase after it found support near the $202 zone, beating Bitcoin and Ethereum . SOL climbed above the $208 level to enter a short-term positive zone.
The price even smashed the $215 resistance. The bulls were able to push the price above the $218 barrier. A high was formed at $220 and the price is consolidating gains above the 23.6% Fib retracement level of the upward move from the $199 swing low to the $220 high.
Solana is now trading above $212 and the 100-hourly simple moving average. There is also a bullish trend line forming with support at $216 on the hourly chart of the SOL/USD pair.
On the upside, the price is facing resistance near the $220 level. The next major resistance is near the $228 level. The main resistance could be $232. A successful close above the $232 resistance zone could set the pace for another steady increase. The next key resistance is $244. Any more gains might send the price toward the $250 level.
Downside Correction In SOL?
If SOL fails to rise above the $220 resistance, it could start another decline. Initial support on the downside is near the $216 zone and the trend line. The first major support is near the $210 level or the 50% Fib retracement level of the upward move from the $199 swing low to the $220 high.
A break below the $210 level might send the price toward the $202 support zone. If there is a close below the $202 support, the price could decline toward the $195 support in the near term.
Technical Indicators
Hourly MACD – The MACD for SOL/USD is gaining pace in the bullish zone.
Hourly Hours RSI (Relative Strength Index) – The RSI for SOL/USD is above the 50 level.
Major Support Levels – $216 and $210.
Major Resistance Levels – $220 and $232.

Institutional Adoption Rises: 21X Brings Chainlink Into Europe’s Tokenized Securities Market
Chainlink’s price is wrestling with key support near $21, a level that has drawn heavy attention fro...
Bitcoin Breakdown Averted? Analyst Says This Level Will Determine BTC’s Fate
After retesting the range lows, Bitcoin (BTC) has closed the week above a key area, momentarily prev...
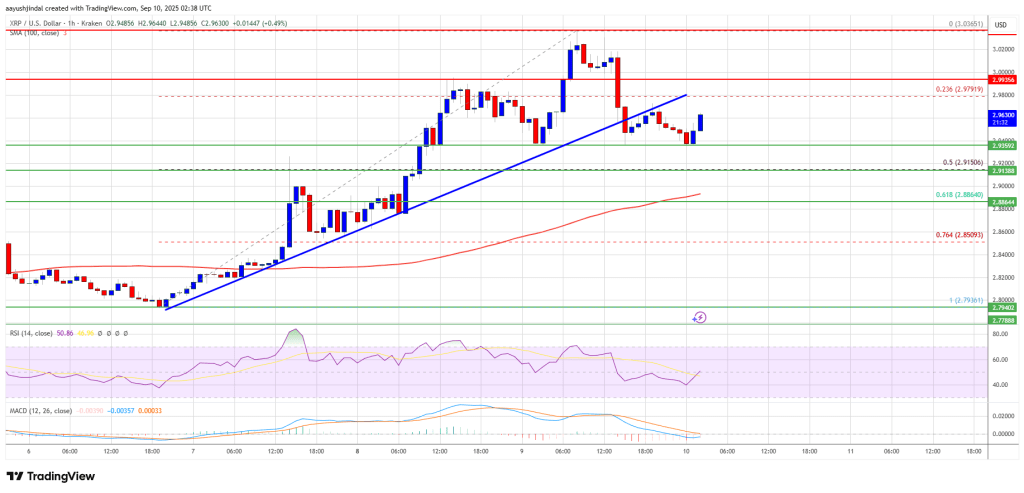
XRP Price Pullback Limited – Bulls Prepare for Next Leg Higher
XRP price gained pace for a move above the $2.920 resistance. The price is now correcting some gains...