XRP Price Remains in Danger Zone – Is a Bigger Crash Coming?


XRP price is struggling to recover above the $2.850 zone. The price is now moving lower and might start another decline below $2.750.
- XRP price is facing hurdles and struggling to recover above the $2.850 resistance.
- The price is now trading below $2.820 and the 100-hourly Simple Moving Average.
- There is a connecting bearish trend line forming with resistance at $2.8180 on the hourly chart of the XRP/USD pair (data source from Kraken).
- The pair could continue to decline if it stays below the $2.850 zone.
XRP Price Faces Hurdles
XRP price managed to stay above the $2.70 level and started a recovery wave, like Bitcoin and Ethereum . The price climbed above the $2.75 and $2.80 resistance levels.
However, the price seems to be struggling to settle above the $2.850 resistance zone. Recently, there was a fresh bearish reaction below the $2.820 level. The price dipped below the 50% Fib retracement level of the upward move from the $2.70 swing low to the $2.887 high.
The price is now trading below $2.820 and the 100-hourly Simple Moving Average. If the bulls protect the $2.780 support, the price could attempt another increase. On the upside, the price might face resistance near the $2.820 level. There is also a connecting bearish trend line forming with resistance at $2.8180 on the hourly chart of the XRP/USD pair.
The first major resistance is near the $2.850 level. A clear move above the $2.850 resistance might send the price toward the $2.880 resistance. Any more gains might send the price toward the $3.00 resistance. The next major hurdle for the bulls might be near $3.050.
More Losses?
If XRP fails to clear the $2.820 resistance zone, it could continue to move down. Initial support on the downside is near the $2.780 level or the 61.8% Fib retracement level of the upward move from the $2.70 swing low to the $2.887 high. The next major support is near the $2.744 level.
If there is a downside break and a close below the $2.744 level, the price might continue to decline toward $2.70. The next major support sits near the $2.650 zone, below which the price could gain bearish momentum.
Technical Indicators
Hourly MACD – The MACD for XRP/USD is now gaining pace in the bearish zone.
Hourly RSI (Relative Strength Index) – The RSI for XRP/USD is now below the 50 level.
Major Support Levels – $2.780 and $2.70.
Major Resistance Levels – $2.850 and $2.880.
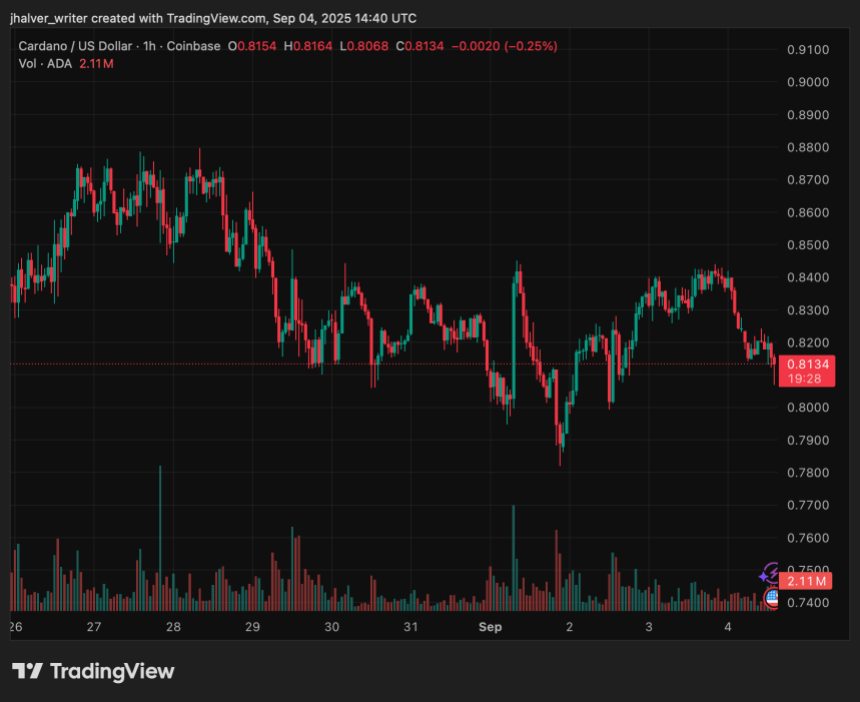
Cardano Price Prediction: ADA Bears Test Support, Bulls Eye $0.92 Breakout on Hoskinson Boost
Cardano (ADA) has entered September with mixed signals. On-chain data from Santiment reveals that re...
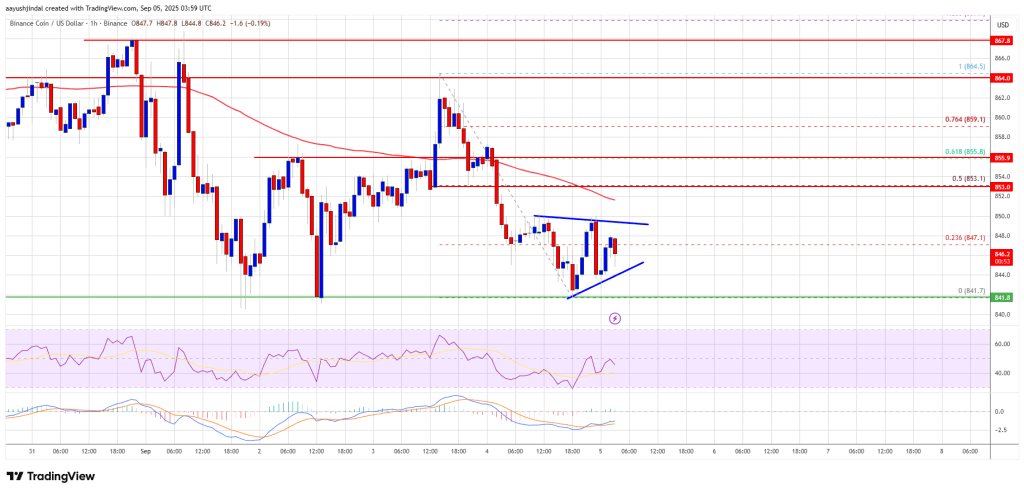
BNB Price Struggles Below $850 – Is Momentum Fading Fast?
BNB price is consolidating losses below the $850 zone. The price is now facing hurdles near $855 and...
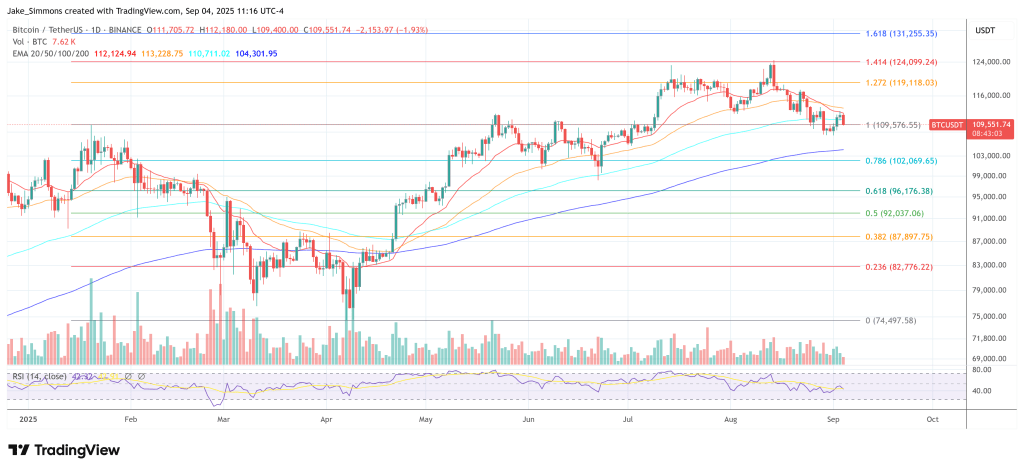
Crypto Volatility Alert: Friday’s US Jobs Report Could Trigger Major Move
The August US labor readings have turned Friday’s nonfarm payrolls into a live-fire macro event for ...