Dogecoin Signal That Nailed The Top Says It’s Time To Buy


An analyst has pointed out how Dogecoin has just seen a short-term buy signal on the same indicator that captured the latest local top in its price.
TD Sequential Has Just Formed A Buy Signal For Dogecoin
In a new post on X, analyst Ali Martinez has talked about a Tom Demark (TD) Sequential signal that has appeared in the hourly price chart of Dogecoin. The TD Sequential is an indicator from technical analysis (TA) that’s used to locate potential reversal points in an asset’s price.
The indicator works by counting up candles printed in the same color. These candles may or may not be consecutive. Once nine candles of the same polarity appear, the metric suggests the trend may be nearing exhaustion, and a reversal could occur for the asset.
Naturally, where the price would head after the TD Sequential’s setup comes down to the polarity of the preceding nine candles. If the candles were green, the asset may see a bearish turnaround. Similarly, red candles would instead suggest a rebound to the upside.
Now, here is the chart shared by Martinez that shows the quick TD Sequential signals that Dogecoin has formed on the hourly timeframe during the past day:
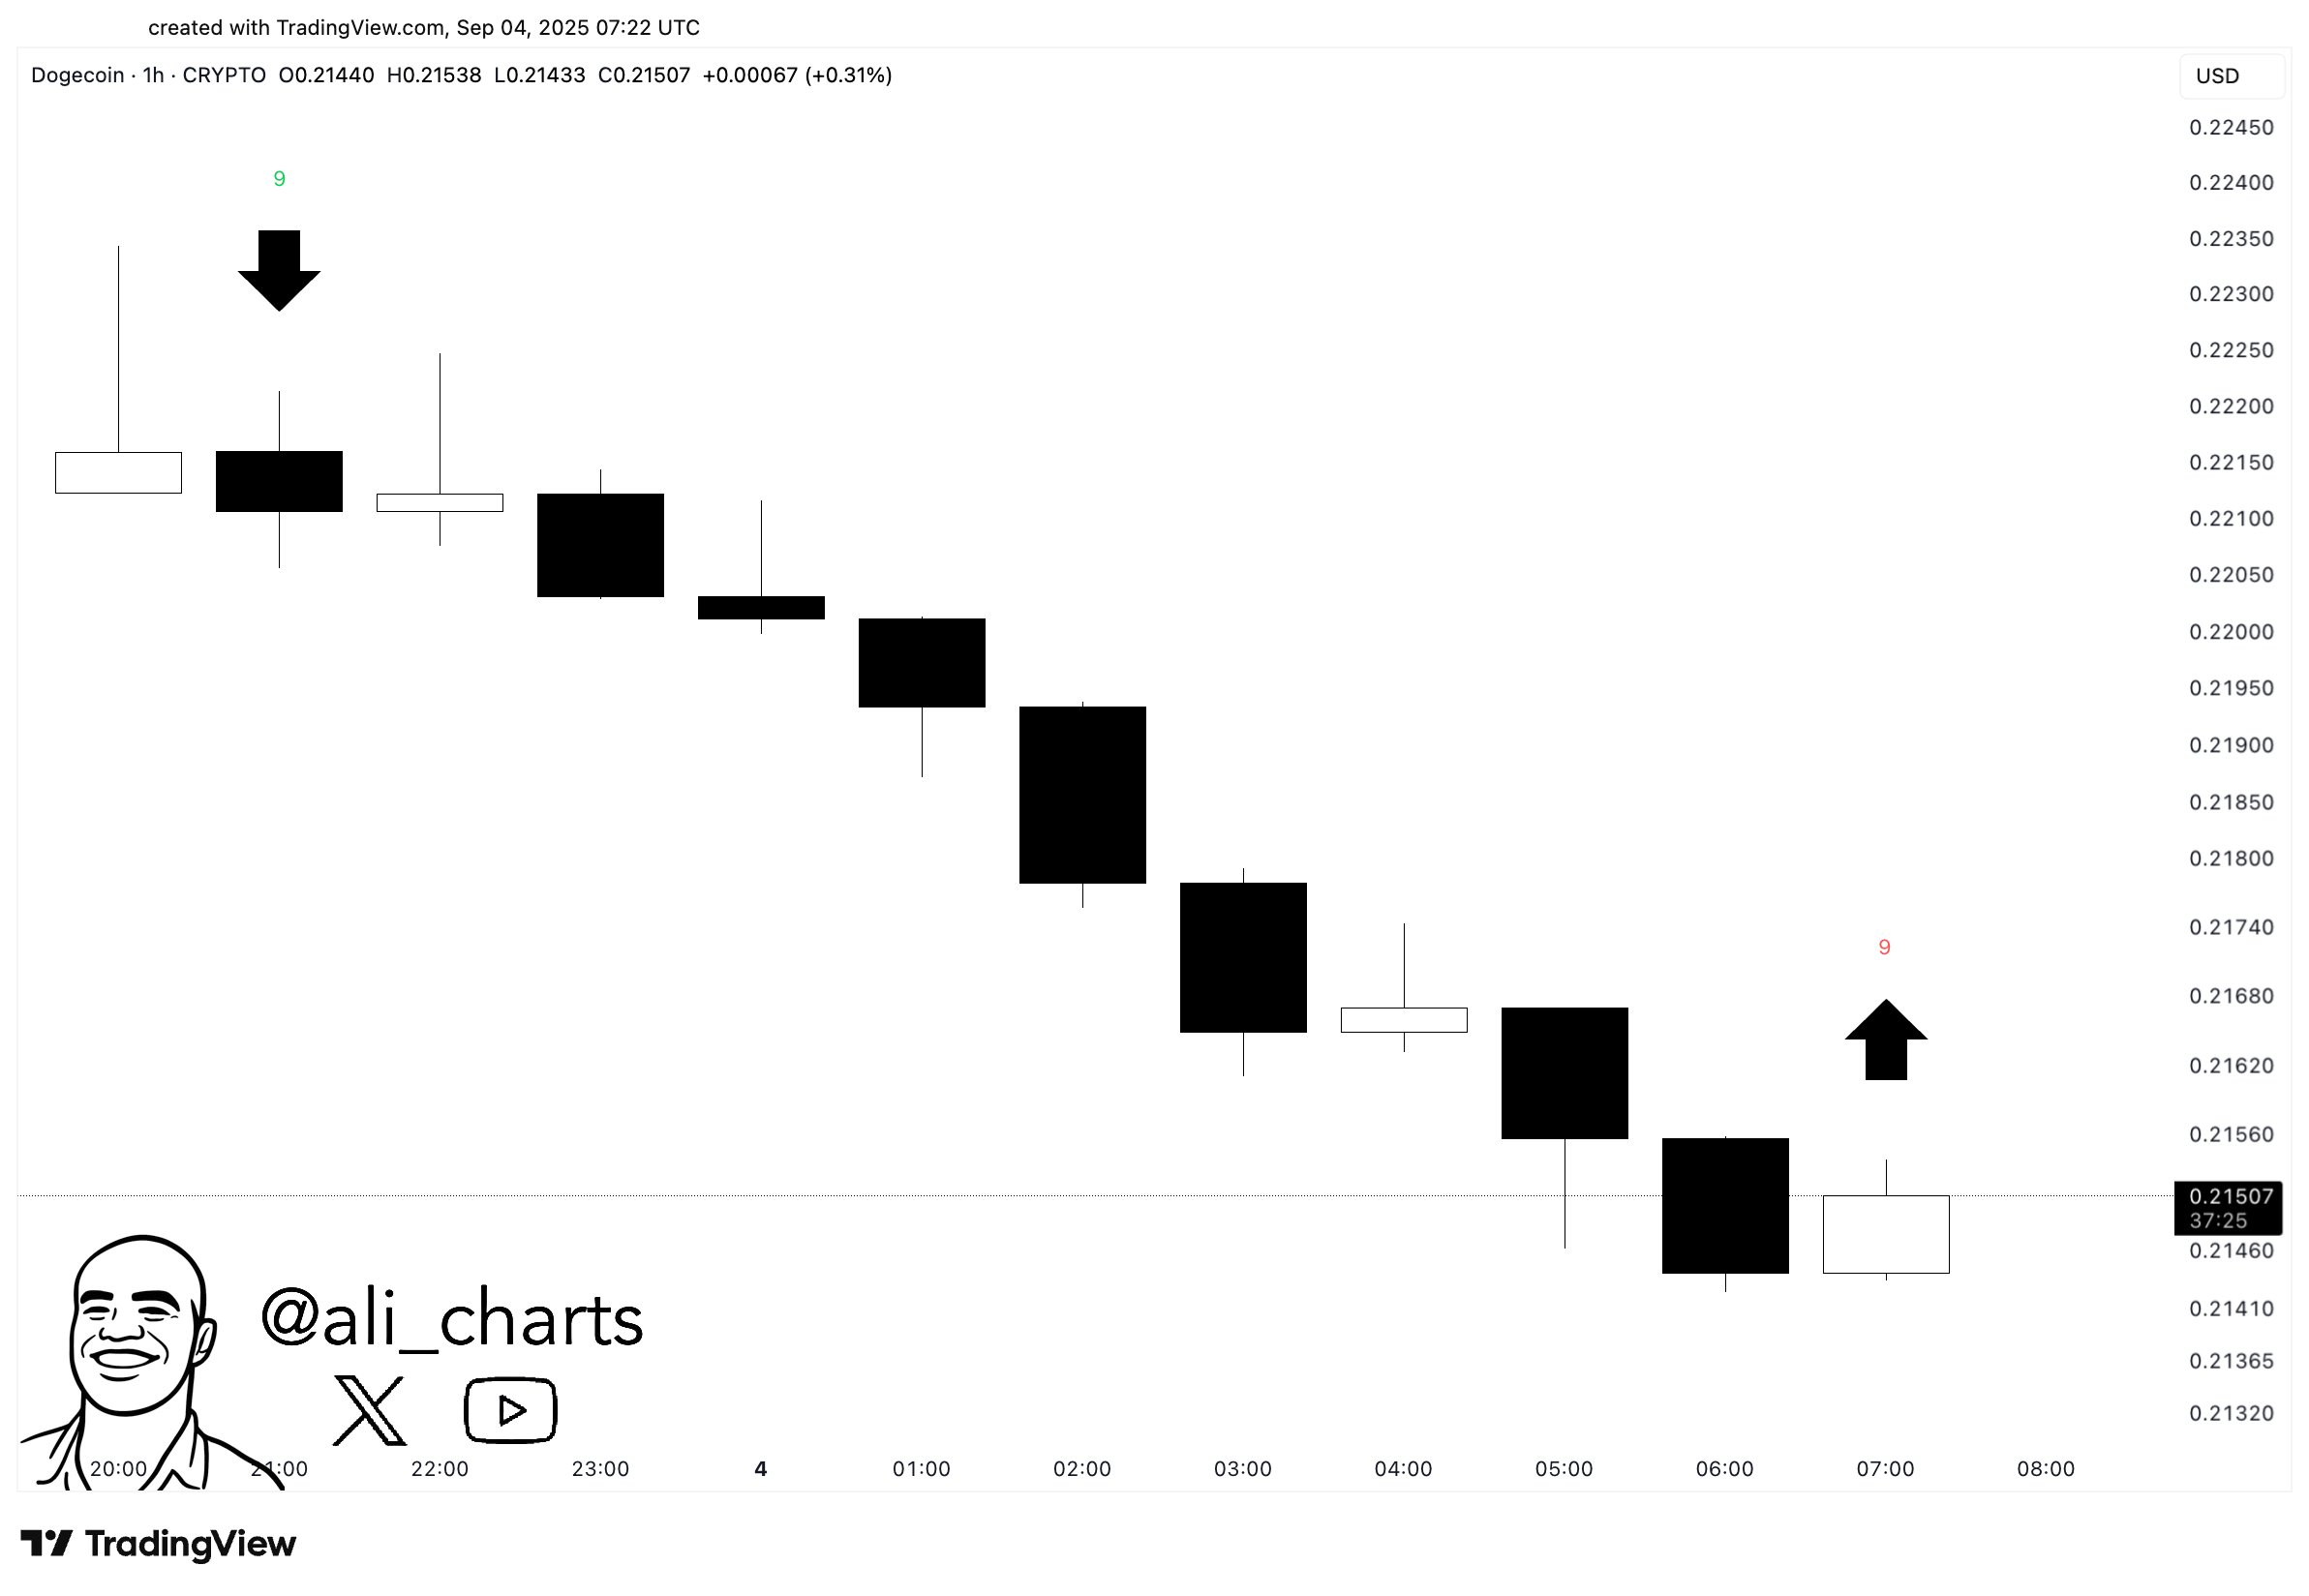
As is visible in the graph, Dogecoin completed a TD Sequential setup in its 1-hour price on Wednesday. The signal came as the memecoin’s price rallied beyond the $0.22 level. Since the setup finished with nine green candles, the indicator implied a potential turnaround to the downside for the asset. And indeed, since the signal, DOGE has seen a pullback.
From the chart, it’s apparent that this drawdown has meant that another quick TD Sequential setup has appeared, this one involving nine red candles. Considering that the last signal coincided with a top, this new one may imply a short-term bullish rebound for Dogecoin. It now remains to be seen whether the indicator will hold.
In some other news, on-chain data shows DOGE whales are currently not making any major moves, as the analyst has pointed out in another X post .

The above chart displays the data of the Supply Distribution from on-chain analytics firm Santiment, which is an indicator that tells us about the amount of supply that a particular DOGE wallet segment is holding right now. Here, Martinez has chosen the 10 million to 100 million tokens cohort, popularly known as the whales.
It would appear that the total holdings of this group has fallen to sideways movement recently, indicating that the large investors are sitting on the sidelines, participating in neither distribution nor accumulation.
DOGE Price
At the time of writing, Dogecoin is floating around $0.215, down more than 3% over the last seven days.

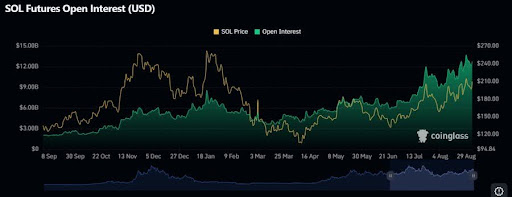
Solana Futures Market Surges As Open Interest Hits Record Levels, A Rally Brewing?
Solana’s futures Open Interest (OI) has reached a new all-time high. This record level of activity h...
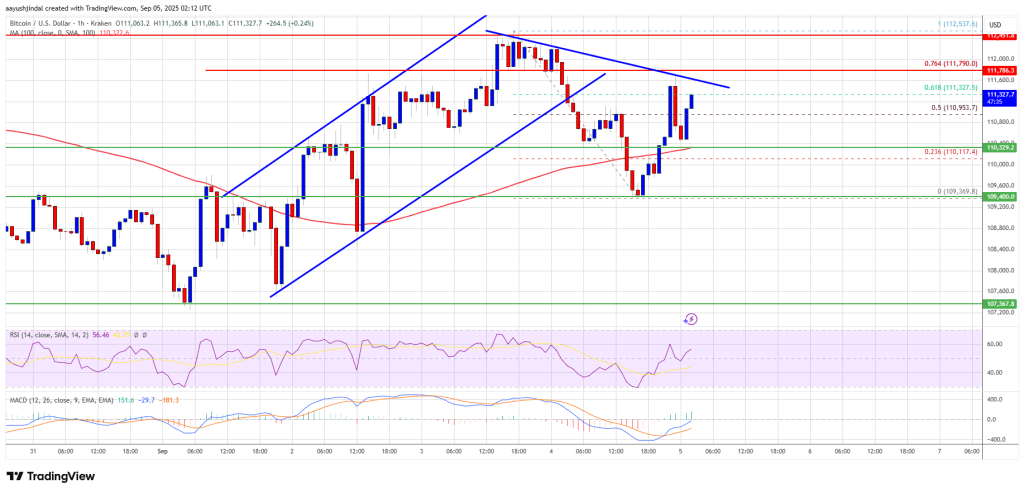
Bitcoin Price Gains Steam – $112K Level Could Decide the Next Surge
Bitcoin price is attempting a recovery wave above $111,500. BTC is now rising and might gain pace if...
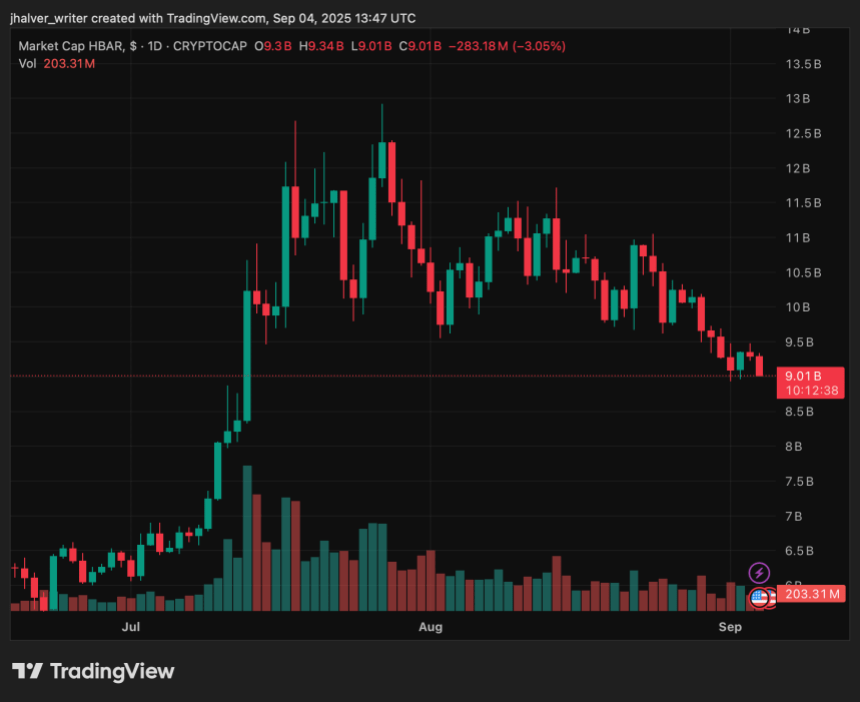
Hedera Bears Take Charge With 10% Weekly Drop, But Key Support Could Spark Recovery
Hedera Hashgraph’s native token, HBAR, has been under intense selling pressure, recording a 12% decl...