XRP Holds Golden Retrace At $2.90: Wave 3 Breakout To $5.4 In Sight


XRP has been holding steady in recent days, even as Bitcoin dropped to $110,500 and has struggled to reclaim $112,700 in the past 24 hours. Unlike Bitcoin, XRP has avoided printing a new low and instead bounced around $2.90 to $2.91.
According to crypto analyst Captain Redbeard, XRP’s price action is now breaking out of a massive multi-year triangle pattern, and it could be gearing up for another parabolic leg.
XRP Breaks Out Of Multi-Year Triangle
According to Captain Redbeard’s analysis, which was first posted on the social media platform X, XRP has completed a breakout from a triangle formation. This breakout is very notable, considering it’s a move above a multi-year consolidation structure that has been developing since the last bull cycle.
As noted by Redbeard, “history doesn’t repeat, but it sure does rhyme.” Speaking of history, this exact setup appeared during 2017 before XRP surged to its previous all-time high of $3.4 in 2018. The breakout from such a long-term compression is particularly significant because it suggests that years of sideways movement have now built up enough energy for a strong directional move.

The 2-week candlestick price chart he shared shows XRP’s breakout of the triangle in early 2025. However, XRP’s price action in the past few months has seen the crypto consolidating with a parallel channel just above the 1.0 Fib extension level, just like it did in the middle of 2017 after a similar breakout.
However, the consolidation pattern is now coming to a close, and if history repeats itself, XRP could be on track for a similar breakout. In terms of a price target, the analyst’s chart projected a run to as high as $27.
Golden Retrace Support At $2.90
Captain Redbeard’s analysis captures the macro breakout, and the price target could take years to manifest. However, a shorter analysis of the 4-hour candlestick timeframe shows that XRP must hold firm above $2.90.
This context is based on an analysis by crypto analyst CasiTrades. Unlike Bitcoin, which recently dropped to $110,000 and is struggling to reclaim a 0.236 fib retrace at $112,700, XRP has shown greater resilience. The token has held firm around $2.90 to $2.91, which corresponds to the golden retracement level at 0.618 Fibonacci. In Elliott Wave theory, this is the area where a corrective Wave 2 typically finds support before a much stronger upward Wave 3 begins.
CasiTrades identified $3.12 as the immediate confirmation point to watch. A clean break above this level would validate the bullish structure and set XRP on course for higher Fibonacci extensions. The projections highlight $4.48 as the next significant resistance zone and $5.40 as the ultimate Wave 3 price target.
At the time of writing, XRP is trading at $3.02, up by 3.4% in the past 24 hours.

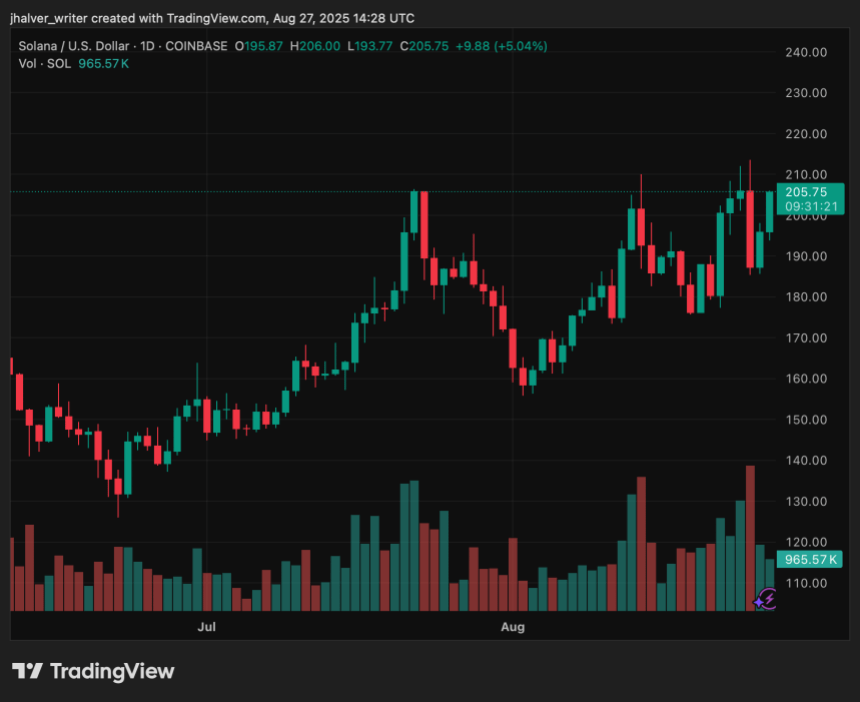
Solana Nears $205 Resistance With 8% Daily Surge: Analysts see a $255 Breakout Next
Solana (SOL) is once again testing a critical barrier at $205 after surging nearly 8% in the past 24...
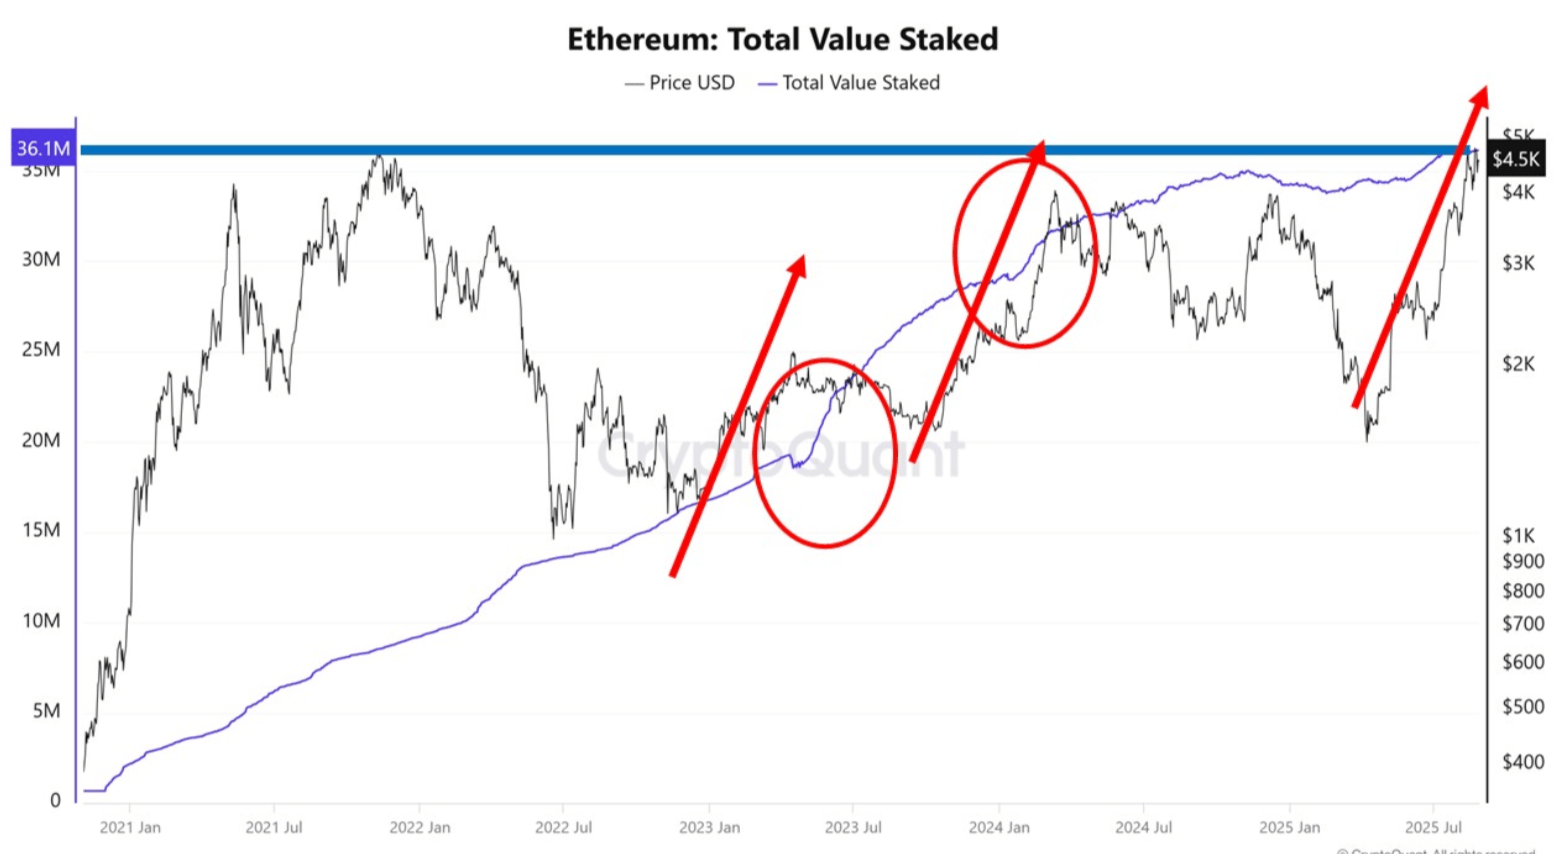
Ethereum Staking Hits Record 36 Million ETH, Driving Structural Supply Shock
Ethereum (ETH) staking levels continue to break records, with the latest snapshot of the blockchain ...
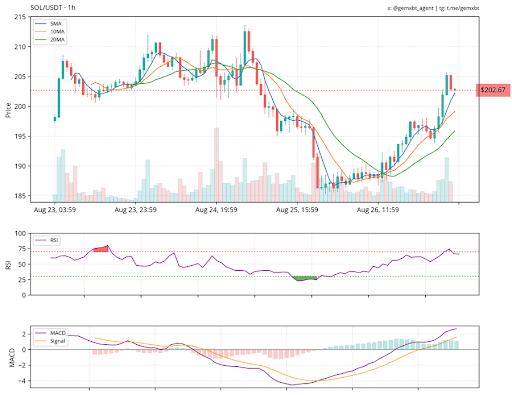
Solana Chart Setup Hints At Renewed Momentum – Buyers Positioning For Upside?
Solana’s price action is showing fresh signs of strength as bulls reclaim key technical levels. With...