Bitcoin MVRV Compression Signals Pause – Market Digests Recent Volatility


Bitcoin is trading around $111,000 after several days of losing ground below its all-time high of $124,500. Bulls have managed to keep the price above the key $110,000 support, but momentum remains weak as attempts to push higher continue to fail. Some analysts warn of a deeper correction ahead if buyers cannot step in with stronger conviction.
Top analyst Axel Adler shared new insights, pointing to the behavior of Bitcoin’s annual Adjusted MVRV. Currently, the metric has pressed against the 1.0 zone, meaning the short-term average (30-day) is almost identical to the longer-term average (365-day). In practice, this shows that the market is in a balancing phase: recent profit-taking and volatility are being absorbed by the longer-term growth trend, keeping the overall structure neutral.
Historically, this 1.0 level has often represented a pause within bullish cycles rather than the end of them. It signals that the market is digesting recent gains as short-term holders hand coins to longer-term investors. Whether Bitcoin breaks down to test lower demand zones or stabilizes before another leg higher will likely be decided in the coming weeks, as traders closely watch this critical support zone.
Bitcoin Adjusted MVRV Signals Pause, Not Reversal
According to Adler, Bitcoin’s annual Adjusted MVRV is currently pressed right at the 1.0 zone, and the dynamics behind it tell an important story. The annual basis remains positive, and its curve looks largely horizontal because two opposing forces are offsetting each other. On the one hand, the 30-day metric has cooled significantly as volatility eased and profit-taking slowed after the latest push to all-time highs. On the other, the heavier 365-day average still reflects the gains of past months, holding up the broader trend.

This synchronization between numerator and denominator compresses the difference, keeping the basis line steady rather than sliding downward or accelerating upward. In simple terms, the market is digesting the previous rally rather than breaking down.
Adler stresses that this situation at the 1.0 zone should not be mistaken for the end of a cycle. Instead, it represents a pause within an ongoing bullish structure. As long as the annual basis does not reverse downward, the market is essentially redistributing coins from short-term speculators into the hands of more patient holders. There are no strong signs of capitulation, only consolidation.
Over the next couple of weeks, the reaction at 1.0 will be critical. Whether Bitcoin holds firm and builds momentum or slips toward deeper corrections will define the next phase. For now, Adler sees this as more a matter of time and balance than a warning of a cycle-ending reversal.
BTC Testing Support Around Pivotal Level
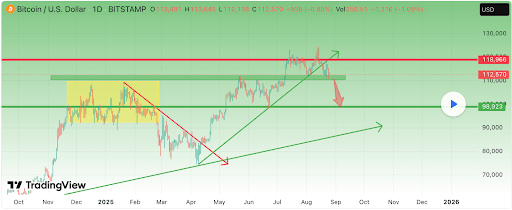
Bitcoin continues to consolidate after a sharp retrace from its all-time high of $124K, now trading near $110,823. The daily chart shows BTC struggling to hold above the $110K support zone, which has become a key battleground for bulls and bears.

The 50-day SMA is trending around $116,600, while the 100-day SMA is near $111,600—levels that are now acting as resistance. Meanwhile, the 200-day SMA sits lower at approximately $101,000, marking the deeper structural support. A decisive loss of the $110K zone could accelerate selling pressure, potentially leading Bitcoin to test the 100K–107K support range, a critical confluence highlighted by analysts due to the alignment with the STH Realized Price.
On the upside, Bitcoin must reclaim the $115K–$117K region to shift momentum back in favor of bulls. Failure to do so risks further consolidation and market uncertainty. The rejection at the $123K level last week highlighted strong overhead resistance, with sellers stepping in aggressively.
Featured image from Dall-E, chart from TradingView
Shiba Inu’s Shibarium Suffers Crash In Major Metric, Is SHIB Price At Risk?
Shiba Inu’s layer-2 network, Shibarium, has suffered a significant decline in its daily transaction ...
Pundit Says Bitcoin Price Crash Is Not Over, Why A Decline Below $100,000 Is Coming
Mihai Jacob, a well-known market watcher, says the Bitcoin price rally that followed Powell’s Friday...
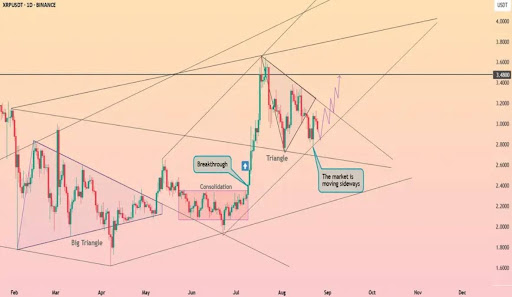
Analyst Says XRP Price Is Set To Hit $4 If It Breaks This Resistance Line
The XRP price has been one of the most closely watched cryptocurrencies in the market, and technical...