Solana (SOL) Closes Above $200 Mark, Bulls Aim for Another Breakout


Solana started a fresh increase above the $188 zone. SOL price is now consolidating above $200 and might aim for more gains above the $212 zone.
- SOL price started a fresh upward move above the $192 and $202 levels against the US Dollar.
- The price is now trading above $200 and the 100-hourly simple moving average.
- There is a rising channel forming with support at $205 on the hourly chart of the SOL/USD pair (data source from Kraken).
- The pair could extend gains if it clears the $212 resistance zone.
Solana Price Aims For More Gains
Solana price started a decent increase after it found support near the $188 zone, unlike Bitcoin and like Ethereum . SOL climbed above the $195 level to enter a short-term positive zone.
The price even smashed the $202 resistance. The bulls were able to push the price above the $208 barrier. A high was formed at $213 and the price is consolidating gains above the 23.6% Fib retracement level of the upward move from the $177 swing low to the $213 high.
Solana is now trading above $200 and the 100-hourly simple moving average. There is also a rising channel forming with support at $205 on the hourly chart of the SOL/USD pair.
On the upside, the price is facing resistance near the $212 level. The next major resistance is near the $215 level. The main resistance could be $220. A successful close above the $220 resistance zone could set the pace for another steady increase. The next key resistance is $225. Any more gains might send the price toward the $232 level.
Downside Correction In SOL?
If SOL fails to rise above the $212 resistance, it could start another decline. Initial support on the downside is near the $205 zone. The first major support is near the $202 level.
A break below the $202 level might send the price toward the $195 support zone and the 50% Fib retracement level of the upward move from the $177 swing low to the $213 high. If there is a close below the $195 support, the price could decline toward the $188 support in the near term.
Technical Indicators
Hourly MACD – The MACD for SOL/USD is gaining pace in the bullish zone.
Hourly Hours RSI (Relative Strength Index) – The RSI for SOL/USD is above the 50 level.
Major Support Levels – $205 and $195.
Major Resistance Levels – $212 and $215.

This Week In XRP: Ripple CTO Set To Announce Important Update
The XRP community has been paying close attention to Ripple’s Chief Technology Officer, David Schwar...
This Altcoin Is A 12,500% Crypto Bet Until 2028, Says Arthur Hayes
BitMEX co-founder and crypto-legend Arthur Hayes used the main stage at Tokyo’s WebX 2025 to unveil ...
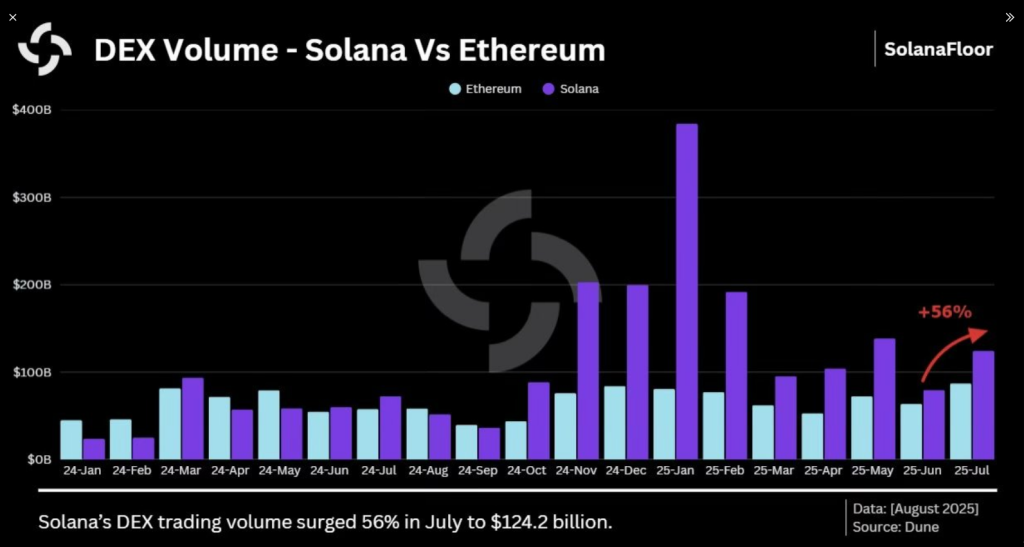
Solana Extends Streak, Outshines Ethereum in DEX Volume – Details
Solana is holding its dominance in decentralized finance with a striking performance in July. Report...