XRP Price Recovery Stalls, Signs Point Toward Renewed Selling Pressure


XRP price is showing bearish signs below the $3.00 resistance zone. The price is struggling to recover above the $2.950 and $3.00 levels.
- XRP price is declining below the $3.00 and $2.950 levels.
- The price is now trading below $2.950 and the 100-hourly Simple Moving Average.
- There is a bearish trend line forming with resistance at $2.9650 on the hourly chart of the XRP/USD pair (data source from Kraken).
- The pair could continue to move down if it stays below the $3.00 zone.
XRP Price Recovery Faces Hurdles
XRP price remained in a bearish zone after a close below the $3.050 level, like Bitcoin and Ethereum . The price extended losses and traded below the $3.00 support zone.
The price even declined below $2.90. Finally, it tested the $2.820 support zone. A low was formed at $2.820 and the price recently corrected some losses. There was a move above the $2.90 level. The price surpassed the 50% Fib retracement level of the downward move from the $3.095 swing high to the $2.820 low.
However, the bears are active below the $3.00 level and the 61.8% Fib retracement level of the downward move from the $3.095 swing high to the $2.820 low. There is also a bearish trend line forming with resistance at $2.9650 on the hourly chart of the XRP/USD pair.
The price is now trading below $2.950 and the 100-hourly Simple Moving Average. On the upside, the price might face resistance near the $2.950 level. The first major resistance is near the $2.9650 level.
A clear move above the $2.9650 resistance might send the price toward the $3.00 resistance. Any more gains might send the price toward the $3.050 resistance. The next major hurdle for the bulls might be near $3.120.
Another Decline?
If XRP fails to clear the $2.9650 resistance zone, it could start a fresh decline. Initial support on the downside is near the $2.90 level. The next major support is near the $2.850 level.
If there is a downside break and a close below the $2.850 level, the price might continue to decline toward the $2.820 support. The next major support sits near the $2.780 zone, below which there could be a sustained drop.
Technical Indicators
Hourly MACD – The MACD for XRP/USD is now gaining pace in the bearish zone.
Hourly RSI (Relative Strength Index) – The RSI for XRP/USD is now below the 50 level.
Major Support Levels – $2.90 and $2.850.
Major Resistance Levels – $2.9650 and $3.00.

Bitcoin Fear Is Back: Traders Flip As Price Plunges To $113,000
Data shows the Bitcoin Fear & Greed Index has seen a bearish flip following the plunge in the crypto...
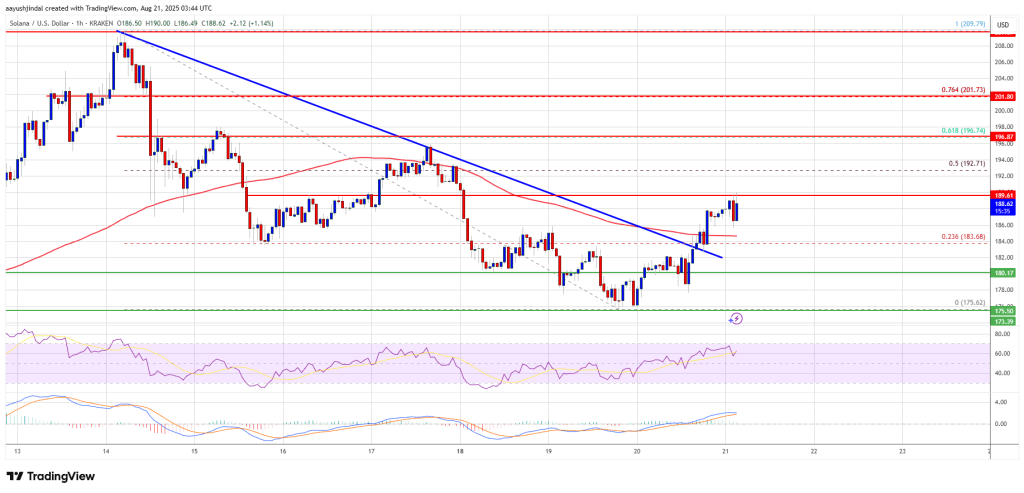
Solana (SOL) Jumps Higher Again, Can Bulls Hold Their Ground?
Solana started a fresh increase from the $175 zone. SOL price is now recovering higher and might aim...
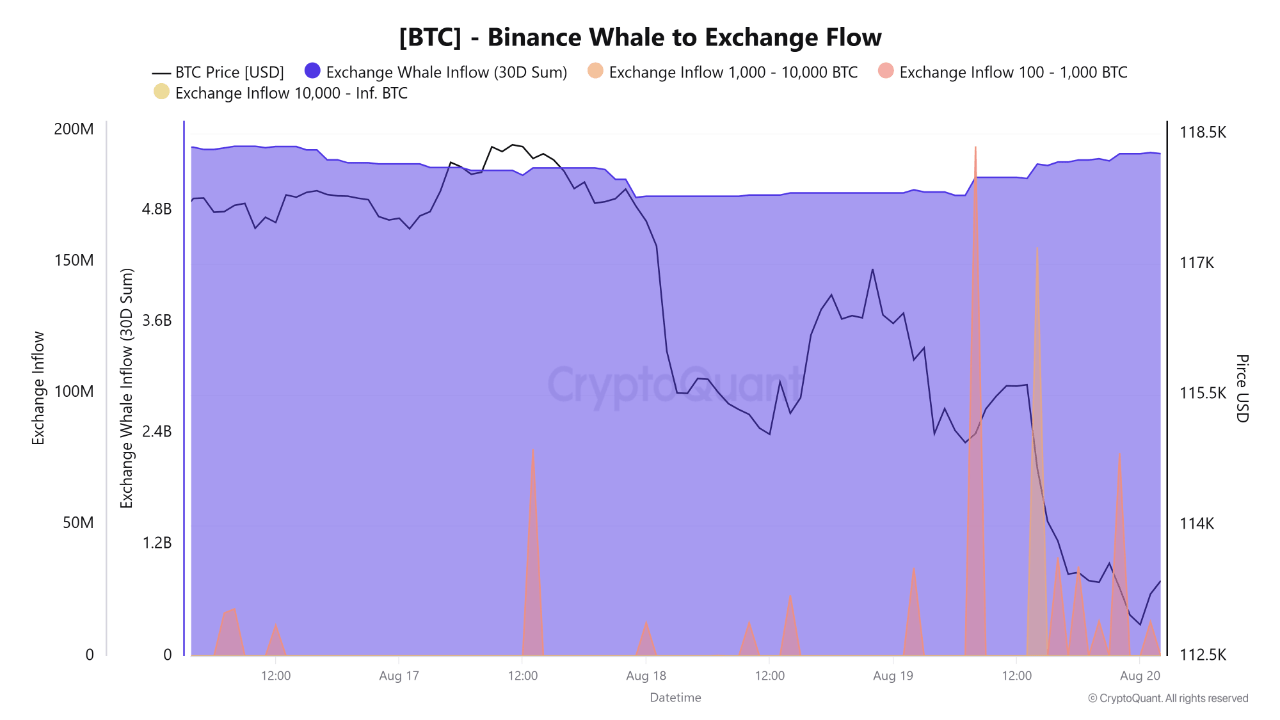
Bitcoin Whales Strike Again: Strategic Selling on Binance Puts $110K in Sight
Bitcoin has retreated from last week’s record high above $124,000, slipping by over 8% in recent day...