Bitcoin Extends Slide as Bears Tighten Grip on Price Action


Bitcoin price is gaining pace below $115,500. BTC is still showing bearish signs and remains at risk of more losses below the $112,000 zone.
- Bitcoin started a fresh decline below the $116,500 zone.
- The price is trading below $115,500 and the 100 hourly Simple moving average.
- There is a key bearish trend line forming with resistance at $115,400 on the hourly chart of the BTC/USD pair (data feed from Kraken).
- The pair might start another increase if it clears the $115,500 resistance zone.
Bitcoin Price Dips Further
Bitcoin price started a fresh decline after a close below the $118,000 level. BTC gained bearish momentum and traded below the $116,500 support zone.
There was a move below the $115,500 support zone and the 100 hourly Simple moving average. The pair tested the $112,500 zone. A low was formed at $112,610 and the price is now consolidating below the 23.6% Fib retracement level of the recent decline from the $124,420 swing high to the $112,610 low.
Bitcoin is now trading below $116,000 and the 100 hourly Simple moving average . Immediate resistance on the upside is near the $114,200 level. The first key resistance is near the $115,000 level. There is also a key bearish trend line forming with resistance at $115,400 on the hourly chart of the BTC/USD pair.
The next resistance could be $115,500. A close above the $115,500 resistance might send the price further higher. In the stated case, the price could rise and test the $118,500 resistance level. It is close to the 50% Fib retracement level of the recent decline from the $124,420 swing high to the $112,610 low. Any more gains might send the price toward the $120,000 level. The main target could be $121,500.
More Losses In BTC?
If Bitcoin fails to rise above the $115,000 resistance zone, it could start a fresh decline. Immediate support is near the $112,500 level. The first major support is near the $112,000 level.
The next support is now near the $110,500 zone. Any more losses might send the price toward the $110,000 support in the near term. The main support sits at $108,000, below which BTC might take a major hit.
Technical indicators:
Hourly MACD – The MACD is now gaining pace in the bearish zone.
Hourly RSI (Relative Strength Index) – The RSI for BTC/USD is now below the 50 level.
Major Support Levels – $112,500, followed by $110,500.
Major Resistance Levels – $115,000 and $115,500.
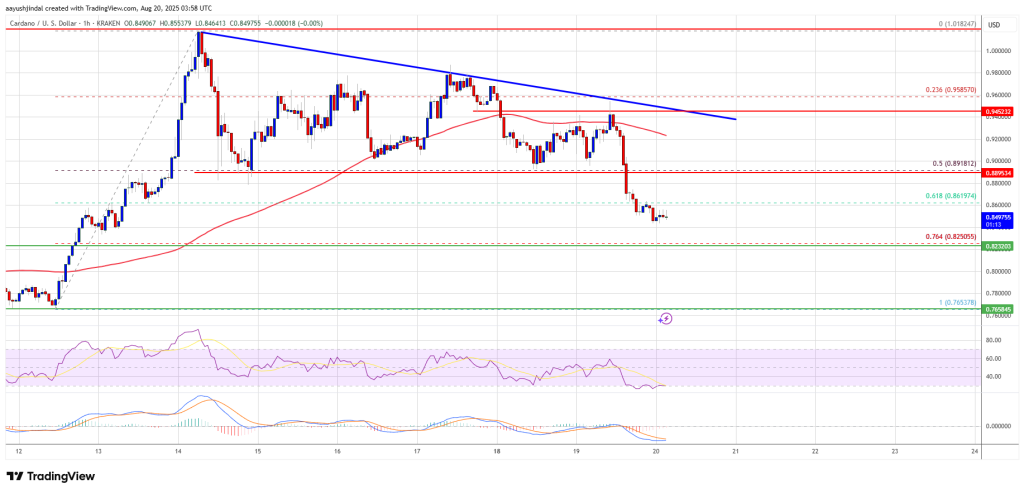
Cardano (ADA) Pulls Back, Will Bears Push It Lower Again?
Cardano price started a downside correction from the $1.020 zone. ADA is now showing some bearish si...

Expert Touts Chainlink Advantage Over XRP In Institutional Adoption Race
As blockchain technology continues to gain traction among institutional investors, Chainlink (LINK) ...
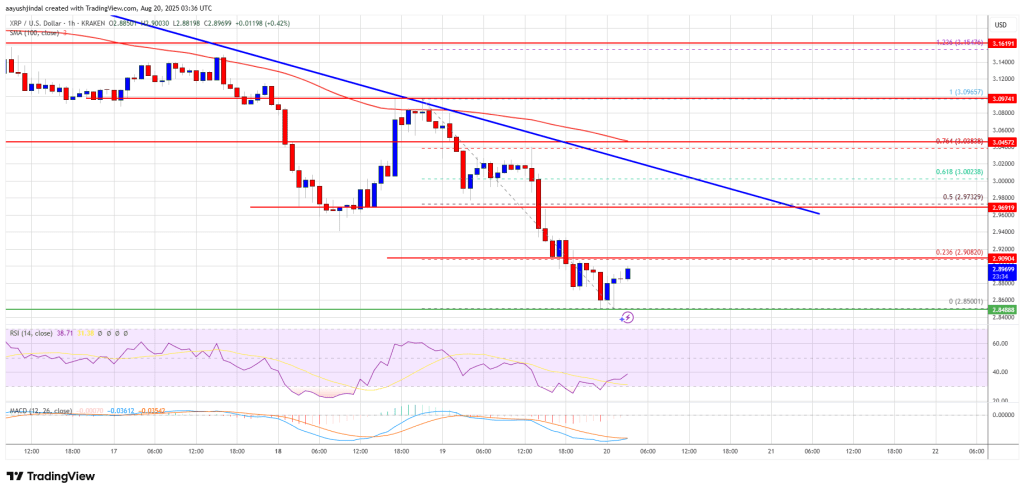
XRP Price Crashes Below $3, More Pain for Bulls?
XRP price is gaining bearish pace below the $3.050 resistance zone. The price is struggling below $3...