XRP Price Consolidation Deepens – Resistance Still Capping Upside


XRP price started a downside correction below the $3.120 zone. The price is now attempting a recovery and might aim for a move above the $3.1650 level.
- XRP price is attempting to start a fresh increase from the $3.00 zone.
- The price is now trading below $3.180 and the 100-hourly Simple Moving Average.
- There is a bearish trend line forming with resistance at $3.150 on the hourly chart of the XRP/USD pair (data source from Kraken).
- The pair could start another increase if it stays above the $3.00 zone.
XRP Price Eyes Upside Break
XRP price started a fresh decline below the $3.20 zone, unlike Bitcoin and Ethereum . The price declined below the $3.120 and $3.080 support levels.
The bears even pushed the price below the $3.020 support zone. Finally, the bulls appeared near the $3.00 level. A low was formed at $2.999 and the price is now attempting a recovery wave. There was a move above the $3.050 and $3.080 levels.
The price surpassed the 23.6% Fib retracement level of the downward move from the $3.330 swing high to the $2.999 low. The price is now trading below $3.150 and the 100-hourly Simple Moving Average. There is also a bearish trend line forming with resistance at $3.150 on the hourly chart of the XRP/USD pair.
On the upside, the price might face resistance near the $3.150 level. The first major resistance is near the $3.1650 level. A clear move above the $3.1650 resistance might send the price toward the $3.20 resistance. Any more gains might send the price toward the $3.250 resistance or even $3.30 in the near term. The next major hurdle for the bulls might be near the $3.350 zone.
Another Drop?
If XRP fails to clear the $3.1650 resistance zone, it could start another decline. Initial support on the downside is near the $3.080 level. The next major support is near the $3.00 level.
If there is a downside break and a close below the $3.00 level, the price might continue to decline toward the $2.920 support. The next major support sits near the $2.850 zone where the bulls might take a stand.
Technical Indicators
Hourly MACD – The MACD for XRP/USD is now losing pace in the bearish zone.
Hourly RSI (Relative Strength Index) – The RSI for XRP/USD is now above the 50 level.
Major Support Levels – $3.080 and $3.00.
Major Resistance Levels – $3.1650 and $3.20.
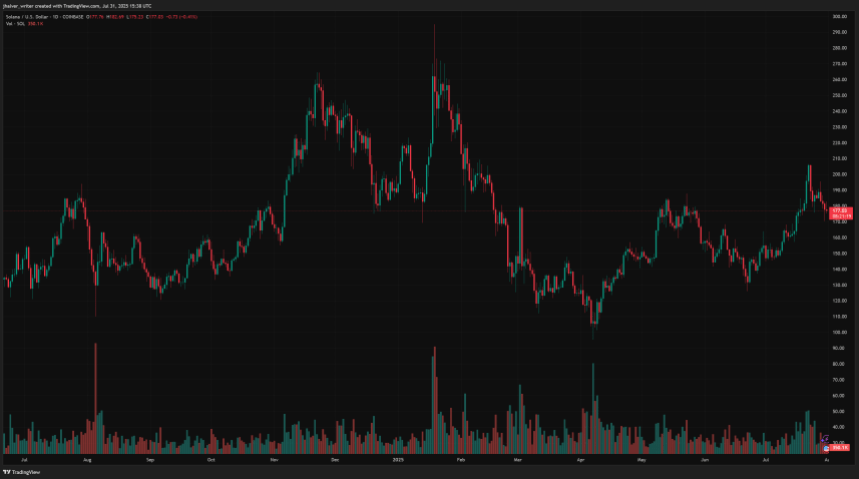
Solana Faces Ethereum Scam Woes as TD Sequential Hints at Bullish Breakout
Solana (SOL) is staging a potential comeback, rebounding 1% to $187.43 after triggering a TD Sequent...
XRP ETF Approval Incoming? Analyst Eyes September-October Window
A fresh move by the SEC could clear the path for the first US spot ETFs tracking altcoins like XRP. ...
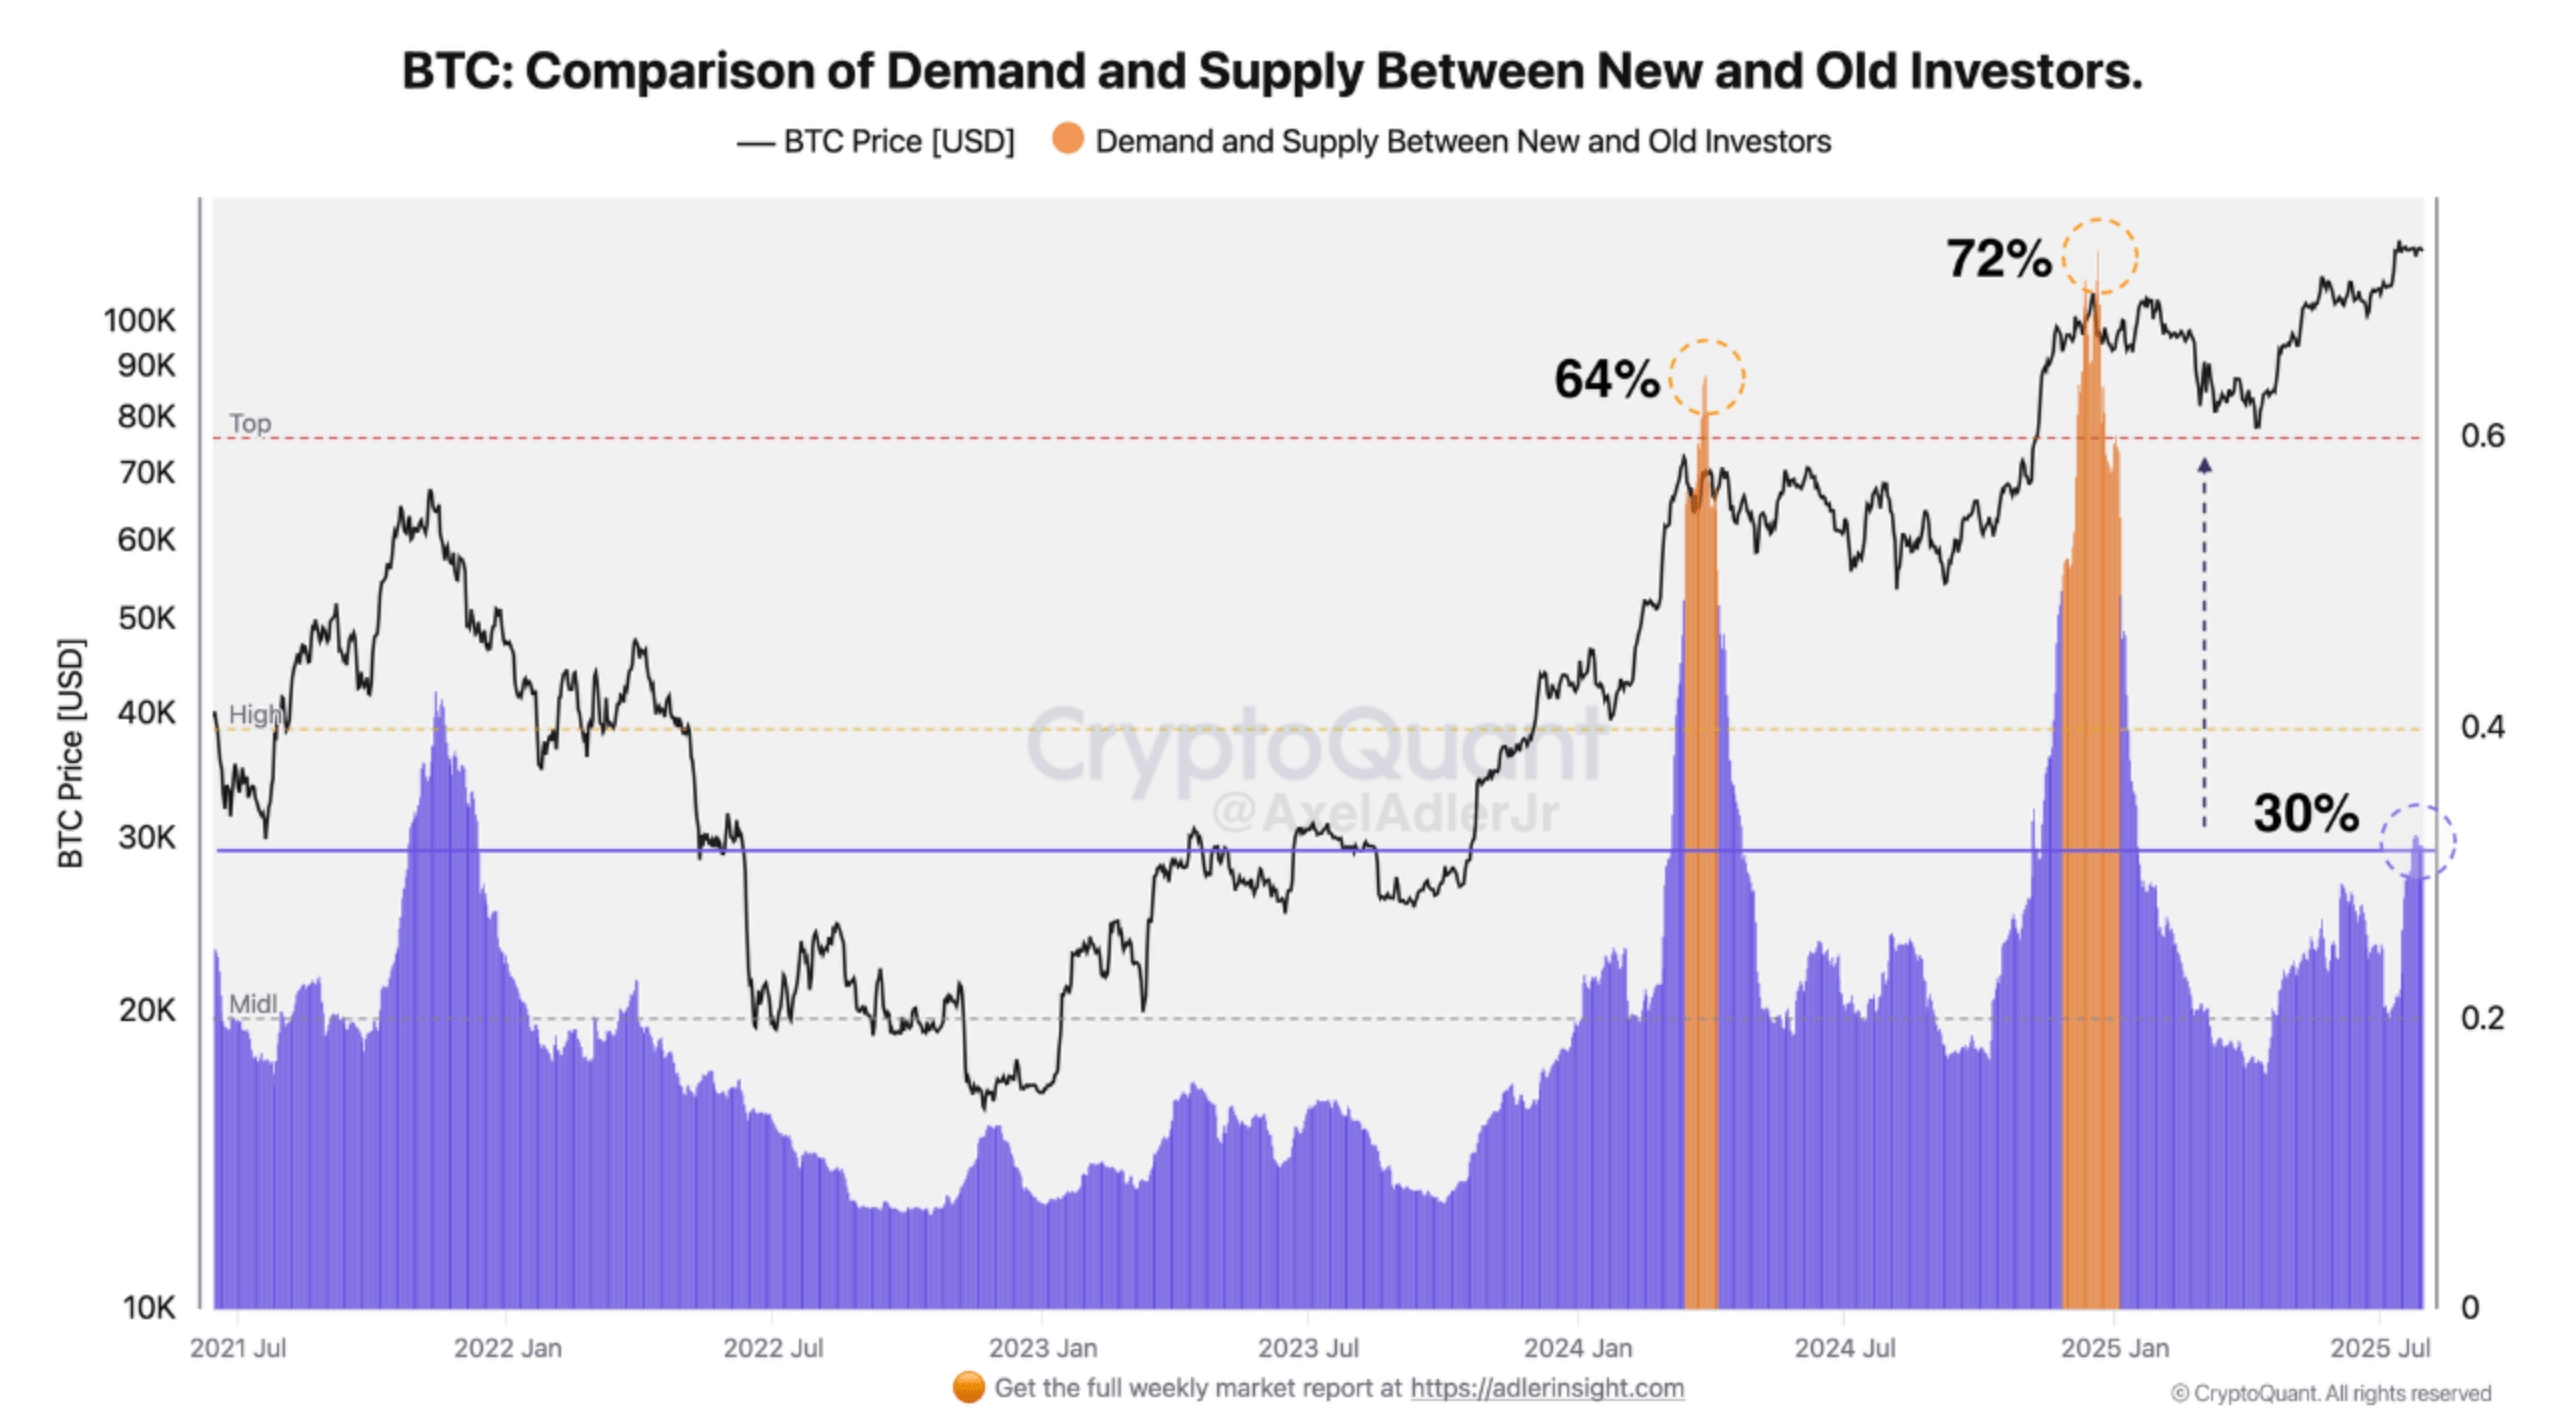
Bitcoin Sees Rising New Investor Dominance, Old Holders Yet To Capitulate
As Bitcoin (BTC) continues to consolidate slightly below the $120,000 level, the dominance of new in...