XRP Price Starts Recovery Move – Will It Lead to a Bullish Reversal?


XRP price started a downside correction below the $3.20 zone. The price is now attempting a recovery and might aim for a move above the $3.180 level.
- XRP price started a fresh pullback below the $3.20 zone.
- The price is now trading below $3.20 and the 100-hourly Simple Moving Average.
- There was a break above a bearish trend line with resistance at $3.120 on the hourly chart of the XRP/USD pair (data source from Kraken).
- The pair could start another increase if it stays above the $3.080 zone.
XRP Price Eyes Fresh Increase
XRP price started a fresh decline below the $3.30 zone, unlike Bitcoin and Ethereum . The price declined below the $3.250 and $3.220 support levels.
The price dipped below the 50% Fib retracement level of the upward move from the $3.004 swing low to the $3.330 high. The bears even pushed the price below the $3.120 support zone. Finally, the bulls appeared near the $3.080 level.
The price found support near the 76.4% Fib retracement level of the upward move from the $3.004 swing low to the $3.330 high. Recently, there was a break above a bearish trend line with resistance at $3.120 on the hourly chart of the XRP/USD pair.
The price is now trading below $3.20 and the 100-hourly Simple Moving Average. On the upside, the price might face resistance near the $3.170 level. The first major resistance is near the $3.20 level. A clear move above the $3.20 resistance might send the price toward the $3.250 resistance. Any more gains might send the price toward the $3.330 resistance or even $3.350 in the near term. The next major hurdle for the bulls might be near the $3.40 zone.
Another Drop?
If XRP fails to clear the $3.20 resistance zone, it could start another decline. Initial support on the downside is near the $3.080 level. The next major support is near the $3.020 level.
If there is a downside break and a close below the $3.020 level, the price might continue to decline toward the $3.00 support. The next major support sits near the $2.980 zone where the bulls might take a stand.
Technical Indicators
Hourly MACD – The MACD for XRP/USD is now losing pace in the bearish zone.
Hourly RSI (Relative Strength Index) – The RSI for XRP/USD is now above the 50 level.
Major Support Levels – $3.080 and $3.020.
Major Resistance Levels – $3.170 and $3.20.
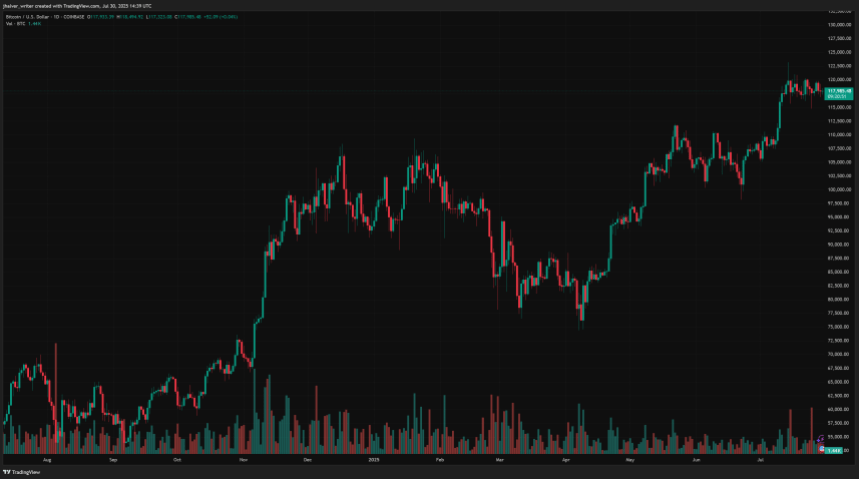
Bitcoin Drops Below $118.5K as Fed Decision and Tariff Fears Shake Crypto Market
Bitcoin faced renewed selling pressure on Wednesday, falling 0.45% to $118,446.5 as traders braced f...

Cardano Eyes 1,000x Explosion—Hoskinson Says Bitcoin’s Out Of Steam
Cardano founder Charles Hoskinson made headlines this week with a bold forecast. He told investors t...

XRP, Dogecoin, And Shiba Inu Get Major Boost From Gemini Exchange Announcement
After a relatively quiet week for altcoins, XRP, Dogecoin, and Shiba Inu received a fresh wave of at...