Bitcoin Accumulation Near $117K Highlights Emerging Support Zone Amid Recent Market Activity


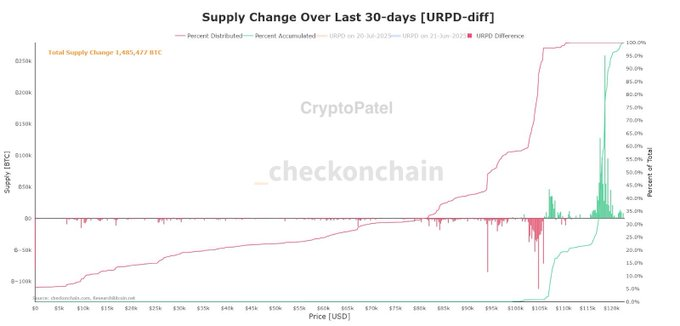
- Over 1.48M BTC shifted with strong accumulation near $115K and selling below $100K.
- Accumulation dominates above $100K while distribution lessens, signaling buyer control.
- $117K–$118K forms key support, with buyers active between $105K and $120K.
Recent Bitcoin’s analysis supply changes over the last 30 days shows a large shift in buying and selling behavior across various price levels. Approximately 1.48 million BTC changed hands during this period, reflecting clear trends in accumulation and distribution that suggest the development of a new support zone near $117,000 to $118,000.
Market participants have shown increased interest in buying between $105,000 and $120,000, while most selling occurred below $105,000. This changing dynamic warrants close observation for its possible impact on Bitcoin’s price movement.
The supply change chart indicates major accumulation activity within the $100,000 to $115,000 range. Green bars above the zero line signify increased accumulation, meaning holders are buying or retaining Bitcoin rather than selling.
This accumulation becomes pronounced as prices near $115,000, where the percentage accumulated nears 100%. This suggests that most market participants in this zone prefer to hold their Bitcoin, reinforcing buying pressure and contributing to price consolidation at these elevated levels.
Distribution Focused Below $100K
Selling activity, or distribution , is concentrated below the $100,000 mark, between $85,000 and $95,000. The red bars below the zero line on the supply change chart highlight significant distribution, indicating that many holders opted to sell or take profits within this price band.
The percentage of Bitcoin distributed climbs through this range, suggesting cautious or profit-taking behavior. However, recent data show that this selling pressure has decreased, signaling that the market may have absorbed much of this supply.
Cumulative Supply Change Lines Reflect Market Trends
Two additional lines on the chart show insight into the cumulative effect of accumulation and distribution. The pink line represents accumulated supply and rises sharply as prices approach and surpass $100,000, while the blue line, representing distributed supply, tapers off. This contrast indicates a market where accumulation has overtaken distribution in recent weeks, illustrating a shift toward buyer dominance at higher price points.

The region between the prices of 117,000 and 118,000 has proven to be one of the support regions. In the unlikely event of a correction in the market, this price level would act as a strong foundation, given that a lot of accumulation has taken place there. The new buyers have joined the market actively at the price level of 105,000 to 120,000, lending their demand that can balance off the selling pressures.

OrangeDX and Kima Network Partner to Enable Seamless Crypto–TradFi Settlements
OrangeDX, the leading Bitcoin DeFi hub, has recently announced forming a strategic partnership with ...

Why This New Social Media Altcoin Could Produce Higher Gains Than Dogecoin And Solana In 2025
Move over Dogecoin and Solana—DeSoc’s $SOC token powers real Web3 social utility and could deliver 1...

XRP Latest News: Could Ripple Reach $5 In 2025 And Why This New Altcoin Is Gaining Worldwide Attention
XRP targets $5 with banking support, but DeSoc’s $10M presale and Web3 social utility may offer the ...

