Are Traders Walking Into a Bitcoin Bull Trap at $118K? Here’s What the Data Shows


Bitcoin’s recent price action reflects a consolidation phase rather than a decisive move in either direction. After briefly touching an all-time high of over $123,000 earlier this month, BTC has seen a gradual pullback, currently trading around $118,000 at the time of writing.
This represents a 1.1% drop in the last 24 hours and a 3.9% decline from its peak, as traders evaluate whether the current market structure suggests a continuation or a correction.
According to new insights from CryptoQuant contributors, indicators present a split narrative. Some metrics suggest rising optimism among traders, while others indicate a more cautious and holding-focused environment .
Surge in Long Positions Raises Contrarian Concerns
CryptoQuant contributor BorisVest highlighted a notable spike in the long/short sentiment ratio on Binance, showing a growing preference among traders for long positions.
This metric, which tracks the volume of long versus short positions on the exchange, has tilted significantly bullish within the $116,000–$120,000 price range.

He noted that during Bitcoin’s previous consolidation between $100,000 and $110,000, sentiment leaned toward short positions, a setup that preceded a breakout to the upside and a wave of short liquidations. This time, however, the environment has flipped. BorisVest explained:
Now that sentiment is skewed heavily toward longs, the same principle could apply in reverse. When the majority positions in one direction, it often creates a setup for the opposite move. The current range is acting as a trap zone, where traders’ expectations are repeatedly tested.
The historical tendency for sentiment extremes to precede contrary price action has prompted some analysts to advise caution, suggesting that growing bullish bias could lead to a temporary reversal if met with enough liquidity pressure.
Bitcoin Exchange Flow Patterns Reflect Investor Patience
While Binance sentiment data leans bullish, another key on-chain indicator paints a different picture. CryptoQuant analyst Arab Chain examined the Bitcoin Flow Pulse (IFP) indicator, which tracks BTC movements to centralized exchanges.
According to the data, despite Bitcoin’s recent high above $120,000, there has not been a corresponding spike in exchange inflows, suggesting that investors are not rushing to take profits or exit the market.

This behavior contrasts with historical cycles in 2017 and 2021, where price peaks were accompanied by large exchange inflows and followed by corrections. Arab Chain wrote:
The market now shows a consolidating trend, with reduced selling pressure. The low flow to exchanges indicates confidence among holders and suggests that many participants are expecting the uptrend to continue.
Still, he cautioned that a shift in the IFP indicator , such as a sudden rise in exchange flows, could act as an early warning for increased supply pressure.

Featured image created with DALL-E, Chart from TradingView

Crypto Founder Reveals What Will Drive Ethereum Price To $10,000
BitMEX co-founder and crypto investor, Arthur Hayes, has outlined the key catalysts that could drive...
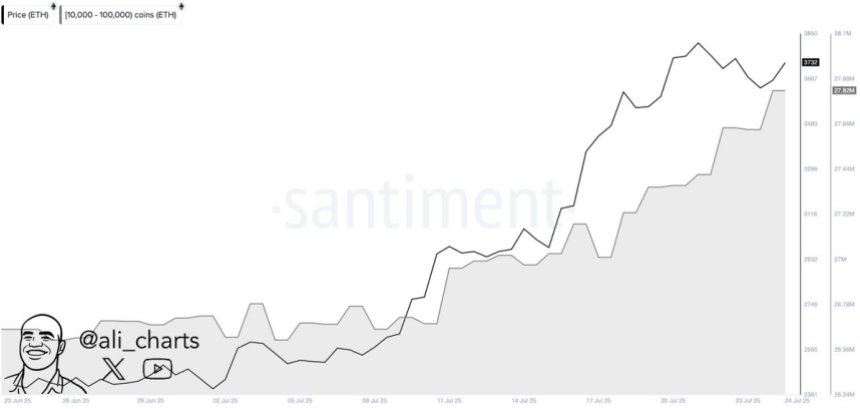
Ethereum Whales Accumulate Over $4.1B In ETH In Two Weeks – Details
Ethereum is showing renewed strength after a sharp but short-lived pullback. Following its recent hi...

Ledger’s Recovery Key Might Be the Best Crypto Wallet Backup Method on the Market
Ledger, the crypto wallet company, released a new backup method yesterday, on July 24. Dubbed the Re...