Bitcoin Price Sets Up for Another Move—Can the Bulls Seal the Deal?


Bitcoin price is eyeing a fresh increase above the $118,000 resistance. BTC must clear the $120,000 resistance zone to continue higher in the near term.
- Bitcoin started a fresh increase after it cleared the $118,000 zone.
- The price is trading above $118,500 and the 100 hourly Simple moving average.
- There was a break above a bearish trend line with resistance at $118,000 on the hourly chart of the BTC/USD pair (data feed from Kraken).
- The pair might start another increase if it clears the $120,000 resistance zone.
Bitcoin Price Aims Higher
Bitcoin price started a correction phase below the $118,500 support zone. BTC dipped below the $118,000 level and tested the $116,200 zone.
A low was formed at $116,260 and the price started another increase. There was a decent move above the $118,000 and $118,500 levels. Besides, there was a break above a bearish trend line with resistance at $118,000 on the hourly chart of the BTC/USD pair.
However, the pair struggled to surpass the $120,000 resistance zone . A high was formed near $120,237 and the price is now consolidating gains near the 23.6% Fib retracement level of the upward move from the $116,260 swing low to the $120,237 high.
Bitcoin is now trading above $118,500 and the 100 hourly Simple moving average. Immediate resistance on the upside is near the $119,800 level. The first key resistance is near the $120,200 level.
The next resistance could be $121,000. A close above the $121,000 resistance might send the price further higher. In the stated case, the price could rise and test the $122,500 resistance level. Any more gains might send the price toward the $122,500 level. The main target could be $123,200.
Another Drop In BTC?
If Bitcoin fails to rise above the $120,200 resistance zone, it could start another decline. Immediate support is near the $119,200 level. The first major support is near the $118,500 level.
The next support is now near the $118,200 zone. Any more losses might send the price toward the $116,500 support in the near term. The main support sits at $115,000, below which BTC might continue to move down.
Technical indicators:
Hourly MACD – The MACD is now losing pace in the bullish zone.
Hourly RSI (Relative Strength Index) – The RSI for BTC/USD is now above the 50 level.
Major Support Levels – $119,200, followed by $118,500.
Major Resistance Levels – $120,200 and $121,000.
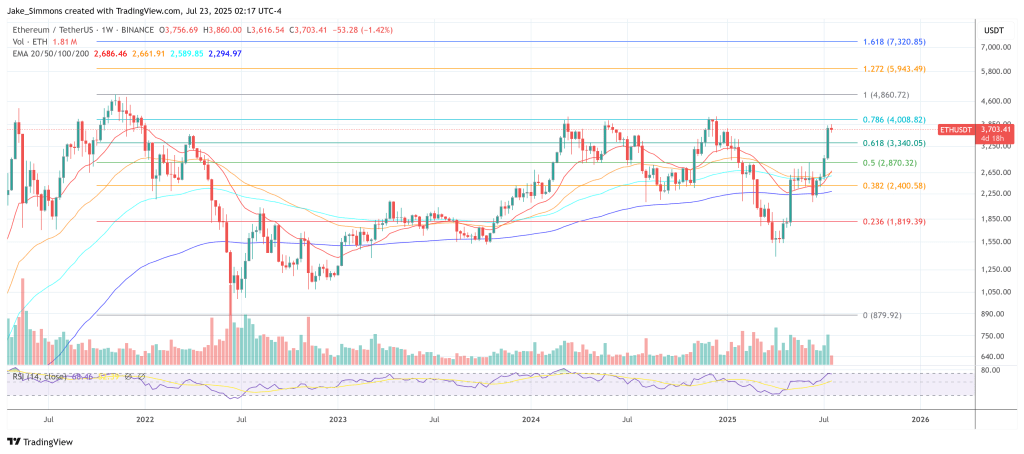
Ethereum Demand Shock Will Rock Markets, Bitwise CIO Warns
A sudden surge of institutional and corporate interest in Ethereum (ETH) is setting the stage for wh...
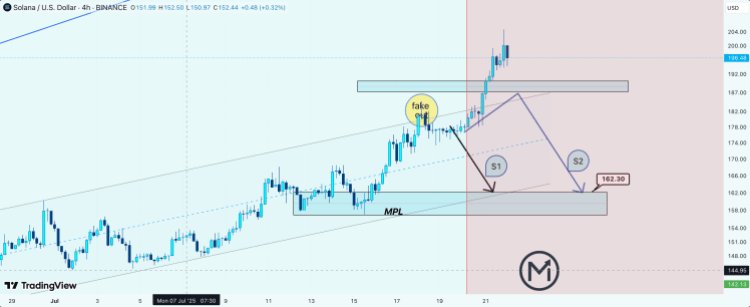
These Two Bearish Scenarios Put Solana Price At $162 After Fakeout
The Solana price has slowly crept up over the last few weeks, moving from a low of $127 back in June...
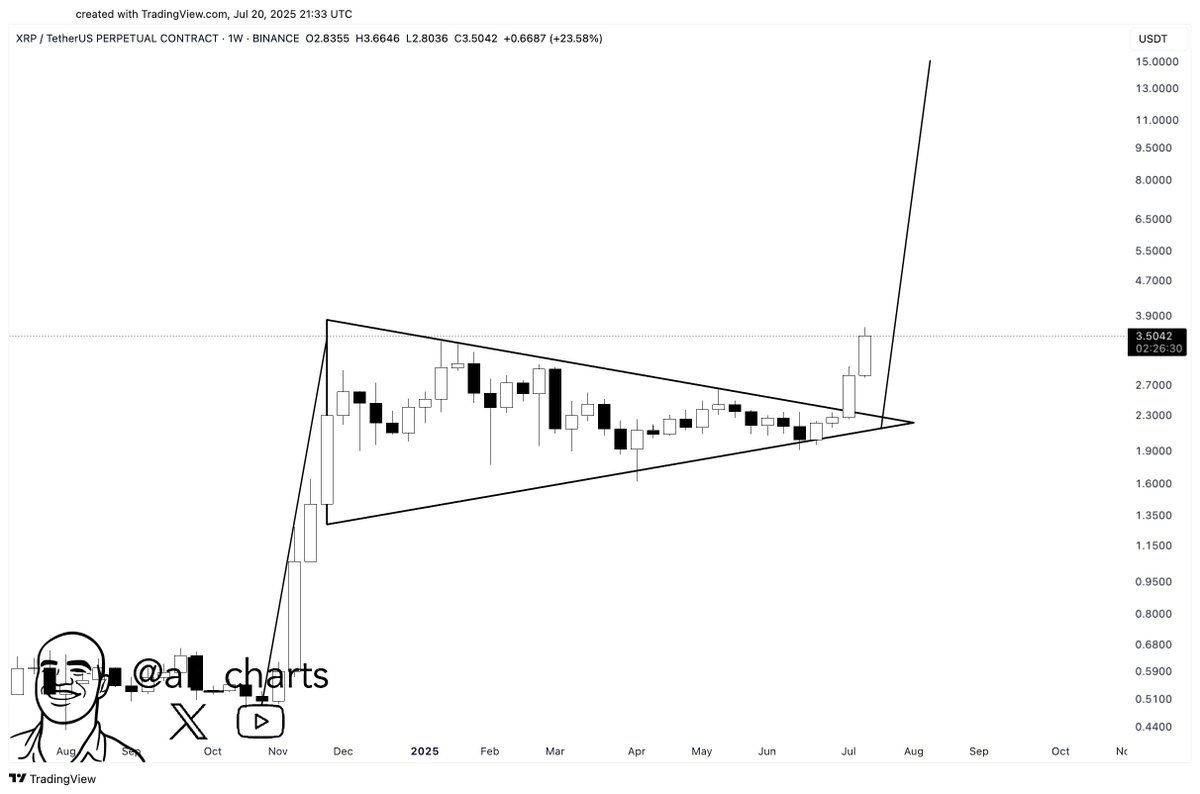
XRP Breaks Out Of Bull Pennant—Is $15 Now In Sight?
An analyst has pointed out that XRP has broken out of a Bull Pennant on the weekly chart and may now...