XRP is eyeing a double-digit target as it observes a Bollinger Bands re-expansion similar to what occurred during the 2017 bull run.
Crypto trader and chartist The Great Mattsby
called
the investing public's attention to this bullish structure. For context, the Bollinger Bands are an indicator that consists of a middle moving average and two outer bands positioned above and below it.
XRP Sees Initial Bollinger Bands Expansion
Notably, when these bands contract or tighten, it typically shows that the price has reached a period of low volatility during a consolidation phase. However, whenever they widen or expand, it signals rising volatility and a possible price breakout from the consolidation.
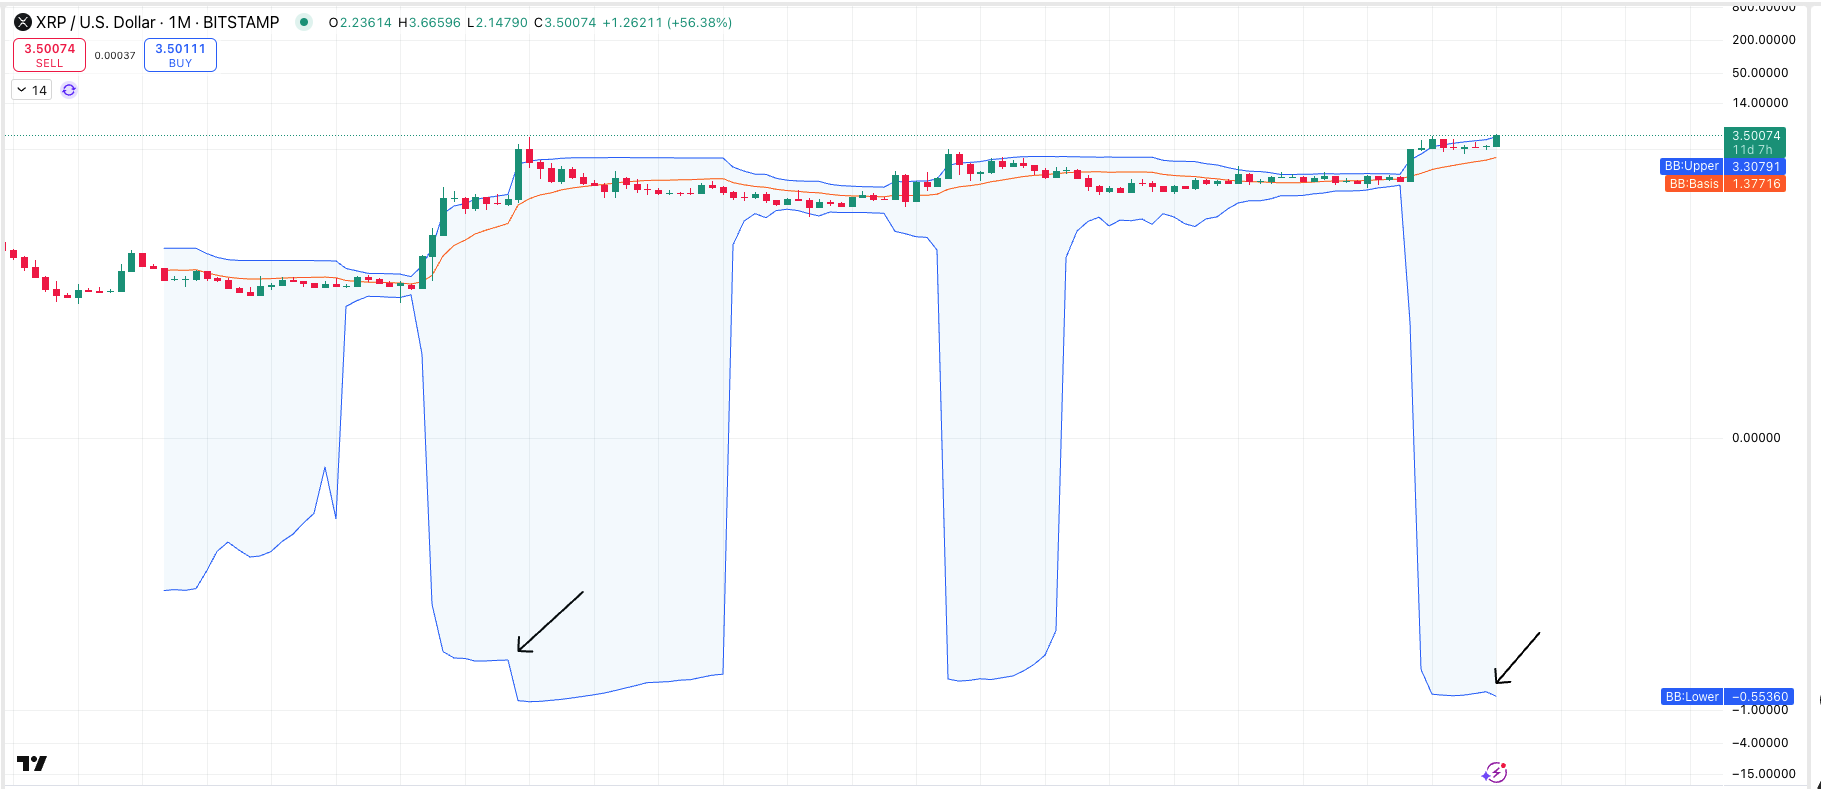
Mattsby's monthly XRP chart shows that
this expansion occurred in November 2024
, when XRP skyrocketed on the back of the Trump-led market run. This expansion persisted into 2025, as XRP sustained its uptrend until it reached a peak of $3.4 in February.
XRP Bollinger Bands Re expansion | The Great Mattsby
Meanwhile, despite the pullback and consolidation that occurred after the $3.4 top, the Bollinger Bands maintained their expansion, especially with XRP sustaining a position above the $2 mark.
XRP Now Observing a Re-expansion: More Upside Ahead?
Now, The Great Mattsby has spotlighted an interesting development surrounding
the Bollinger Bands
. Specifically, as XRP soared past the $2 price level after six months of consolidation at this range, the Bollinger Bands have begun expanding further in what Mattsby calls a "re-expansion" move.
Notably, this re-expansion indicates that XRP is now gradually surging to greater levels. To highlight the possible impact of this new development, the market analyst cited historical context.
For context, XRP observed a similar pattern back in 2017 during its bullish run. After it soared from $0.005 to $0.3988 in early 2017, the Bollinger Bands expanded. However, the roadblock at $0.3988 led to a six-month consolidation, during which the Bollinger Bands maintained their expansion.
Nonetheless, XRP broke out of the consolidation in November 2017, leading to the "re-expansion" of the Bollinger Bands. According to Mattsby, this re-expansion resulted in a further 1,300% rally for XRP, leading to the $3.8 all-time high price by January 2018.
Could XRP Record a 1,300% Uptick?
He believes a similar run could play out as the re-expansion emerges in the current bull cycle. In a subsequent
report
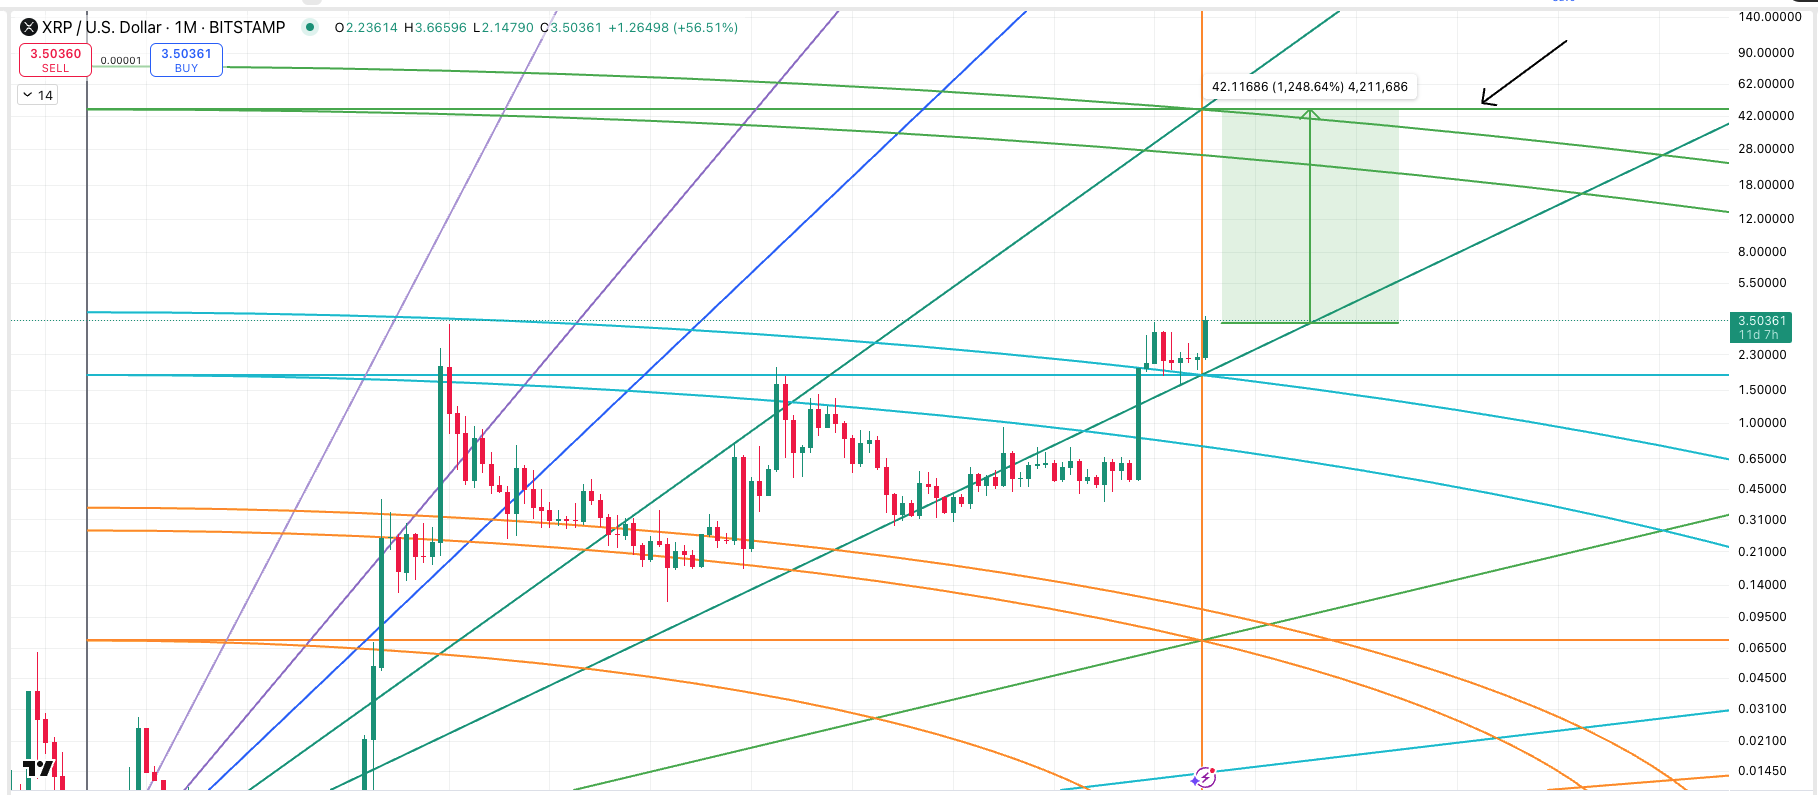
, Mattsby showed that if XRP repeated the 1,300% rally, its price would soar to a new all-time high of $45. According to him, this aligns with the green level of his earlier Gaussian analysis.
XRP Gaussian Analysis | The Great Mattsby
Interestingly, The Great Mattsby also revealed that when this re-expansion began in 2017, XRP saw a massive 800% monthly gain. Market data confirms this disclosure. Specifically, XRP soared from a low of around $0.2 to $1.99 in December 2017, representing an over 800% increase.
https://twitter.com/matthughes13/status/1946984085064143306
Notably, this marked its highest monthly gain in history. With XRP now changing hands at $3.55, if it recorded a similar 746% monthly gain alone,
the price would quickly soar to $30
Disclaimer: This article is copyrighted by the original author and does not represent MyToken’s views and positions. If you have any questions regarding content or copyright, please contact us.(www.mytokencap.com)contact