Bitcoin Touches 8-Year Trendline That Marked Previous Cycle Tops


After rising rapidly over the weekend to hit new all-time highs, the Bitcoin price seems to have hit a brick wall above $120,000, sparking a correction. While this is expected to be a short correction, a notable development involving an 8-year trendline that has marked the top of previous cycles has emerged. If this trendline resistance holds and Bitcoin fails to break it, then it could mean that the top is in, and what usually follows is a drawn-out bear market .
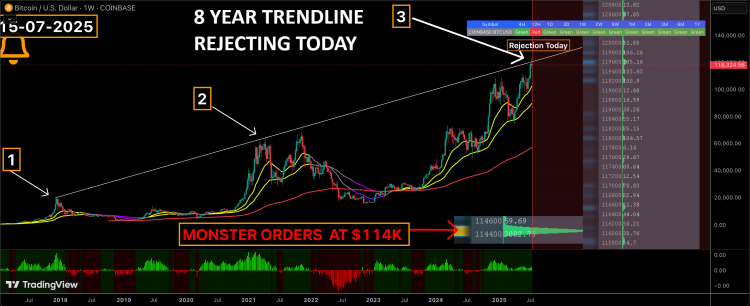
8-Year Trendline Suggests Bitcoin Top Is In
Crypto analyst MartyBoots, in an analysis on TradingView, caught a test of a an 8-year trendline which began back in the 2017-2018 cycle, marking the top of multiple bull markets. This trendline continued into the next major bull market and in the 2020-2021 bull market, the trendline once again marked the cycle top, with Bitcoin peaking at $69,000.
Presently, the Bitcoin price has once again come in contact with this trendline, and the rejection from here does suggest that this trendline could be the real deal. After hitting above $123,000, Bitcoin was promptly pushed back downward from this level as sell-offs and profit-taking became the order of the day.
For this trend to be complete, though, there are a number of things that would need to happen first. For example, the analyst explains that investors should watch for the weakly RSI divergence turning bullish. Additionally, a decline in volume and more rejection wicks for Bitcoin would be confirmation that the price has topped . Marty also explained that the price touching this trendline for a third time increases the odds of it actually playing out the same way it has in the past.
If this trendline does mark the top once again, then it could signal the start of another bear market. As the analyst explains, a top marked by this trendline has in the past “triggered multi-month correction and Bear Markets.”
Still A Chance For Bullish Continuation
The test of this trendline does not necessarily mean that the Bitcoin price has to top at this level , because there is still a chance of bullish continuation. As the analyst explains, a decisive break above the trendline would turn this level into support and trigger further upside.
In addition to this, there is also a lot of buying pressure on the Bitcoin price despite the profit-taking. More importantly is the fact that very large orders await at the $114,000 level. This shows a lot of demand for BTC, something that could drive the price upward as the cost basis for investors remains on the rise.
Nevertheless, the analyst advises caution at this level until there is a confirmation either way. “Risk-management alert: consider tightening stops, reducing leverage, or hedging until trendline fate is resolved,” Marty said in closing.

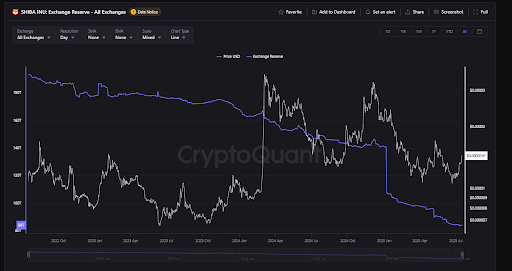
Shiba Inu Exchange Reserves Hit Lowest Level Since 2023 — Why A Price Surge Could Follow
Shiba Inu’s exchange reserves have hit a new low, the lowest level since 2023, providing a bullish o...

Pakistan and El Salvador Team Up on Crypto — What It Means for the Best Presales Right Now
Pakistan and El Salvador have initiated a diplomatic alliance that puts crypto first. It’s the lates...

Big Pharma In The Crypto Game: $60M Investment For BNB Treasury Strategy
Windtree Therapeutics (WINT), a biotech company dedicated to developing therapies for critical healt...