Bitcoin Hits $123,000—But Inflows Are Just A Fraction Of 2024’s Peak


Bitcoin has set a new all-time high (ATH) around $123,000, but cryptocurrency market inflows are still far from the peak observed back in 2024.
Crypto Capital Inflows Are Currently Sitting At $51 Billion
As pointed out by analyst Ali Martinez in a new post on X, there is a stark difference in capital participation between the current Bitcoin rally and the one from December 2024.
Below is the chart shared by the analyst that compares the two bull runs.
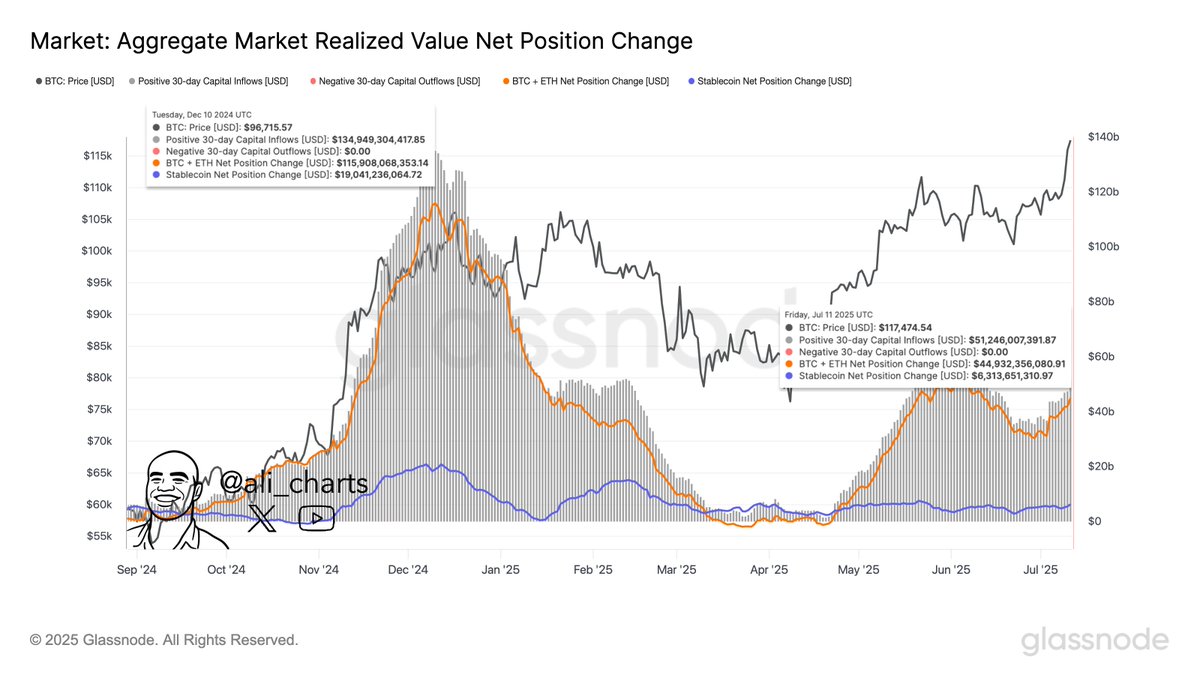
The graph captures the 30-day capital flows occurring for Bitcoin, Ethereum, and the stablecoins . For the former two assets, it tracks them using the Realized Cap indicator.
The Realized Cap is a capitalization model that calculates a given cryptocurrency’s total value by assuming that each coin in the circulating supply has its value equal to the last time it changed hands on the network. In short, what the metric represents is the amount of capital that investors of the asset as a whole have put into it.
Changes in this indicator, therefore, correspond to the entry or exit of capital into the network. As is visible in the chart, the 30-day Realized Cap change for Bitcoin and Ethereum (colored in orange) has gone up alongside the latest price rally , indicating that capital has flowed into these coins.
It’s also apparent that stablecoin flows (blue) have also noted an uptick, although the scale has been smaller. For stables, capital flow can be directly measured using the market cap, since their price is always pegged to $1 means that the Realized Cap never differs from the market cap.
In the cryptocurrency sector, capital mainly comes in through three entry points: Bitcoin, Ethereum, and stablecoins. The altcoins usually only receive a rotation of capital from these assets. Since the flows related to the three have recently been positive, the market as a whole has been getting an injection of capital.
In total, the aggregate capital inflows for the cryptocurrency sector have stood at $51.2 billion for the past month. This is certainly a sizeable figure on its own, but it pales in comparison to what was witnessed before.
As Martinez has highlighted in the chart, the monthly capital flows peaked at almost $135 billion in the December 2024 Bitcoin rally above $100,000, more than double the latest number.
Something to keep in mind, however, is the fact that the previous run was more explosive, while the latest one has come in two waves: an initial recovery surge above $100,000 that led into a consolidation phase and the current breakout into the $120,000 levels. This could, at least in part, explain why the metric has appeared relatively cool recently.
Bitcoin Price
At the time of writing, Bitcoin is trading around $121,700, up nearly 3% over the last 24 hours.

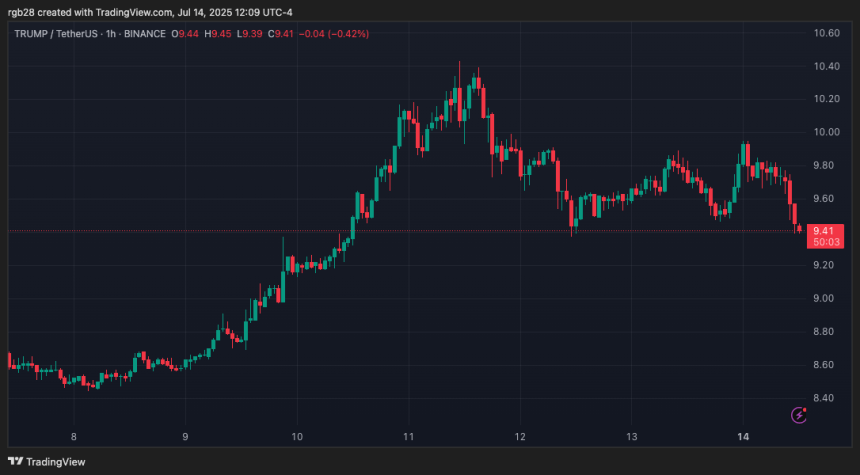
Top Crypto Exchanges Made $172 Million From TRUMP Memecoin Listing – Report
A recent report has found that US President Donald Trump’s official memecoin, TRUMP, had a faster li...
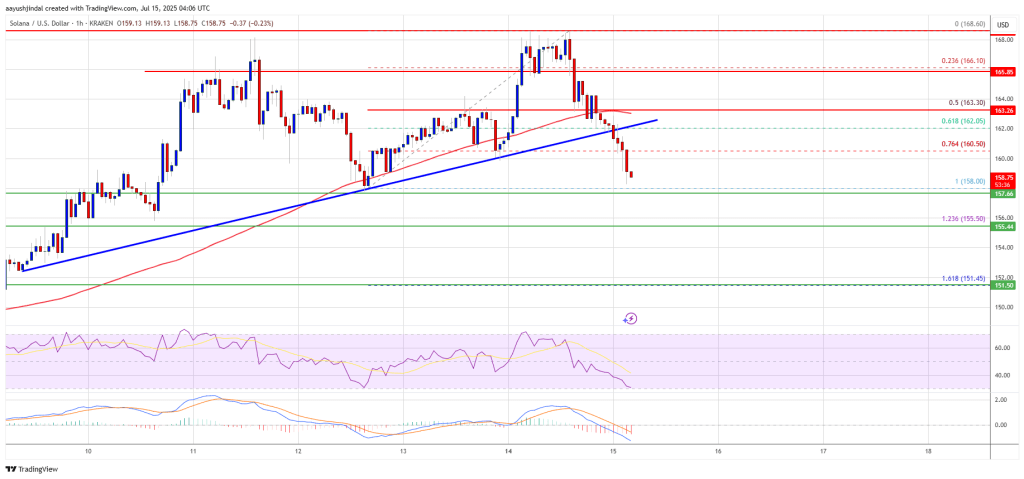
Solana (SOL) Pulls Back — Can Buyers Defend The $155 Line?
Solana started a fresh increase above the $160 zone. SOL price is now correcting gains and might fin...
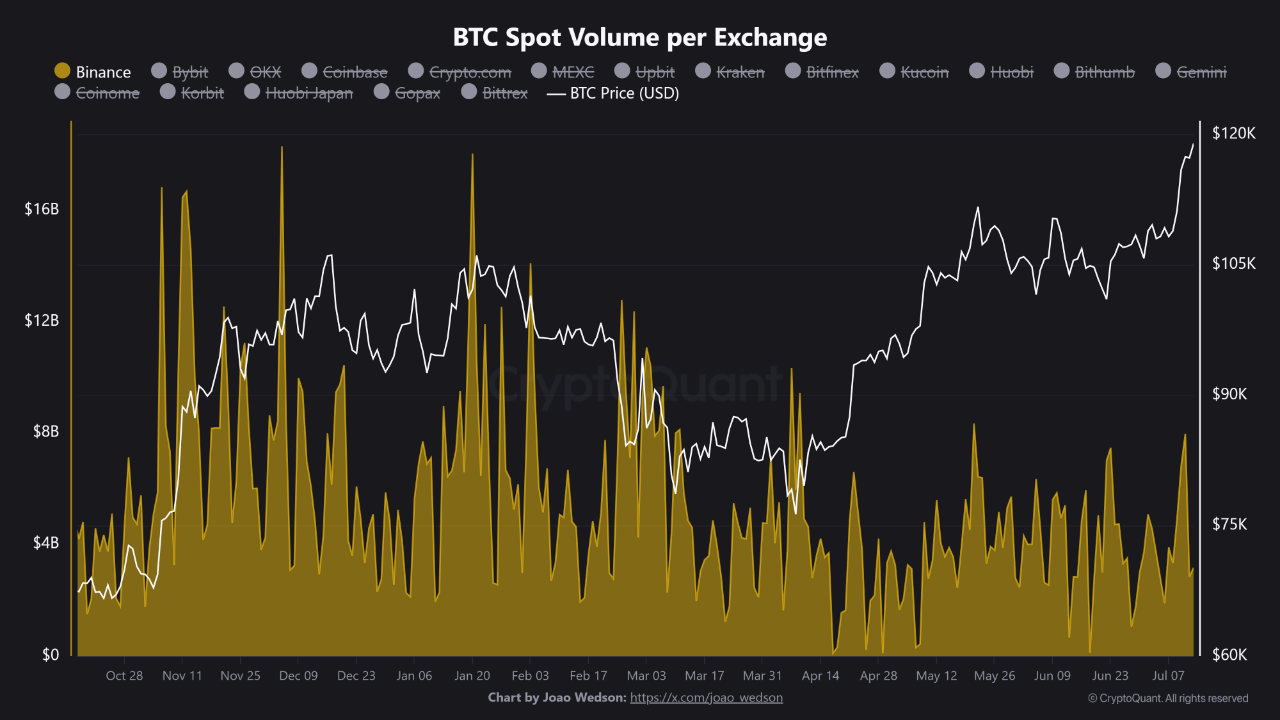
Spot Volume Drop on Binance Preceded Bitcoin’s Price Surge, Data Shows
Bitcoin surged to a new all-time high above $123,000 earlier today after crossing the $120,000 thres...