Bitcoin Price Respects Support Zone — Bulls Eye Fresh Rally


Bitcoin price remained supported above the $107,500 zone. BTC is now recovering losses and might aim for a move above the $109,200 resistance.
- Bitcoin started a recovery wave above the $108,000 zone.
- The price is trading above $108,500 and the 100 hourly Simple moving average.
- There is a bearish trend line forming with resistance at $109,050 on the hourly chart of the BTC/USD pair (data feed from Kraken).
- The pair could start a fresh increase if it stays above the $107,500 zone.
Bitcoin Price Eyes Upside Break
Bitcoin price started a fresh decline after it failed near the $110,000 zone. BTC declined below the $108,500 and $108,000 levels before the bulls appeared.
A low was formed at $107,650 and the price started a recovery wave. There was a move above the $108,500 resistance zone. The price climbed above the 50% Fib retracement level of the downward move from the $109,700 swing high to the $107,500 low.
Bitcoin is now trading above $108,500 and the 100 hourly Simple moving average . The first key resistance is near the $109,050 level. Besides, there is a bearish trend line forming with resistance at $109,050 on the hourly chart of the BTC/USD pair.
The next resistance could be $109,200 or the 76.4% Fib level of the downward move from the $109,700 swing high to the $107,500 low. A close above the $109,200 resistance might send the price further higher. In the stated case, the price could rise and test the $110,000 resistance level. Any more gains might send the price toward the $112,000 level. The main target could be $115,000.
Another Decline In BTC?
If Bitcoin fails to rise above the $109,200 resistance zone, it could start another decline. Immediate support is near the $108,400 level. The first major support is near the $108,200 level.
The next support is now near the $107,500 zone. Any more losses might send the price toward the $105,500 support in the near term. The main support sits at $103,500, below which BTC might continue to move down.
Technical indicators:
Hourly MACD – The MACD is now gaining pace in the bullish zone.
Hourly RSI (Relative Strength Index) – The RSI for BTC/USD is now above the 50 level.
Major Support Levels – $108,500, followed by $107,500.
Major Resistance Levels – $109,200 and $110,000.
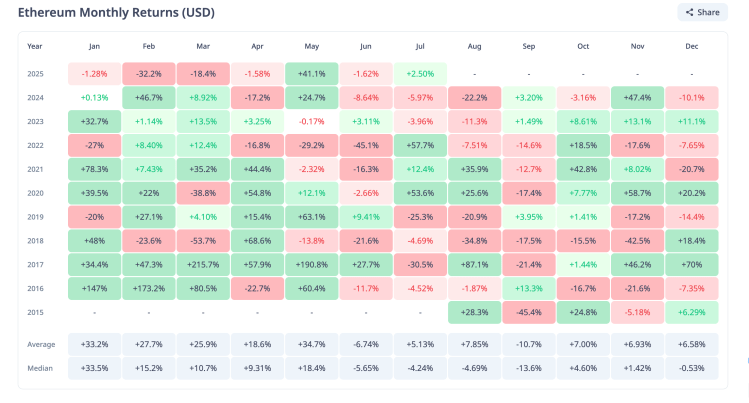
Ethereum Is Already Outperforming Bitcoin In July, Is Altcoin Season Here?
With one week already gone in the month of July, Ethereum has already begun to perform better than B...
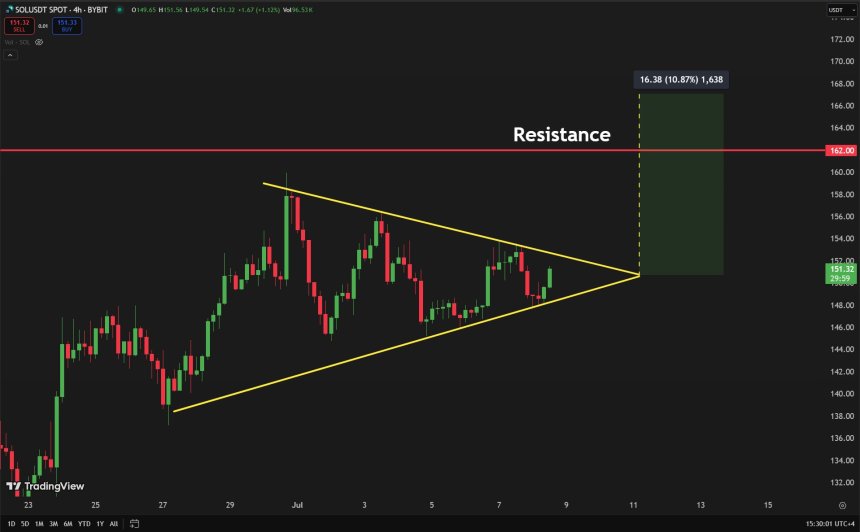
Solana Ready For $160 Reclaim? Analysts Say Breakout Is A Matter Of Time
As the crypto market moves sideways, Solana (SOL) compresses between two key levels. Some analysts s...
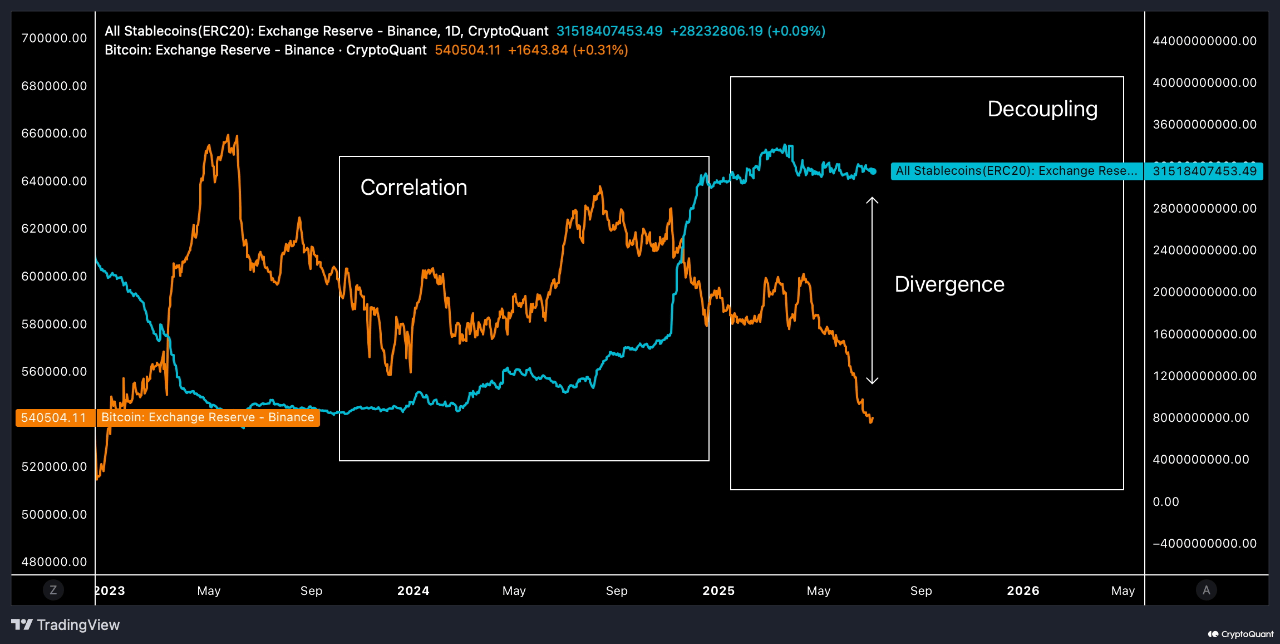
Bitcoin & Stablecoin Reserves Diverge On Binance: Liquidity Explosion Brewing?
On-chain data shows the Binance Exchange Reserve has diverged between Bitcoin and the stablecoins. H...