Bitcoin Price Surges Toward $110K — Will It Finally Stick the Landing?


Bitcoin price started a fresh increase from the $105,200 zone. BTC is now consolidating and might struggle to continue higher above the $110,000 resistance.
- Bitcoin started a fresh increase above the $108,000 zone.
- The price is trading above $107,500 and the 100 hourly Simple moving average.
- There was a break above a bearish trend line with resistance at $106,300 on the hourly chart of the BTC/USD pair (data feed from Kraken).
- The pair could start a fresh increase if it stays above the $107,000 zone.
Bitcoin Price Regains Traction
Bitcoin price remained supported above the $105,000 level and started a fresh increase. BTC cleared many hurdles near $106,200 to start a decent increase.
There was a break above a bearish trend line with resistance at $106,300 on the hourly chart of the BTC/USD pair. The pair pumped above the $107,500 resistance level. It cleared the 76.4% Fib retracement level of the downward move from the $108,792 swing high to the $105,116 low.
Finally, the price surged toward the $110,000 level. It tested the 1.236 Fib extension level of the downward move from the $108,792 swing high to the $105,116 low.
Bitcoin is now trading above $108,000 and the 100 hourly Simple moving average . On the upside, immediate resistance is near the $109,400 level. The first key resistance is near the $110,000 level. A close above the $110,000 resistance might send the price further higher. In the stated case, the price could rise and test the $112,000 resistance level. Any more gains might send the price toward the $113,200 level.
Downside Correction In BTC?
If Bitcoin fails to rise above the $110,000 resistance zone, it could start another decline. Immediate support is near the $108,750 level. The first major support is near the $108,000 level.
The next support is now near the $107,200 zone. Any more losses might send the price toward the $106,500 support in the near term. The main support sits at $105,000, below which BTC might continue to move down.
Technical indicators:
Hourly MACD – The MACD is now losing pace in the bullish zone.
Hourly RSI (Relative Strength Index) – The RSI for BTC/USD is now above the 50 level.
Major Support Levels – $108,000, followed by $107,200.
Major Resistance Levels – $110,000 and $112,000.
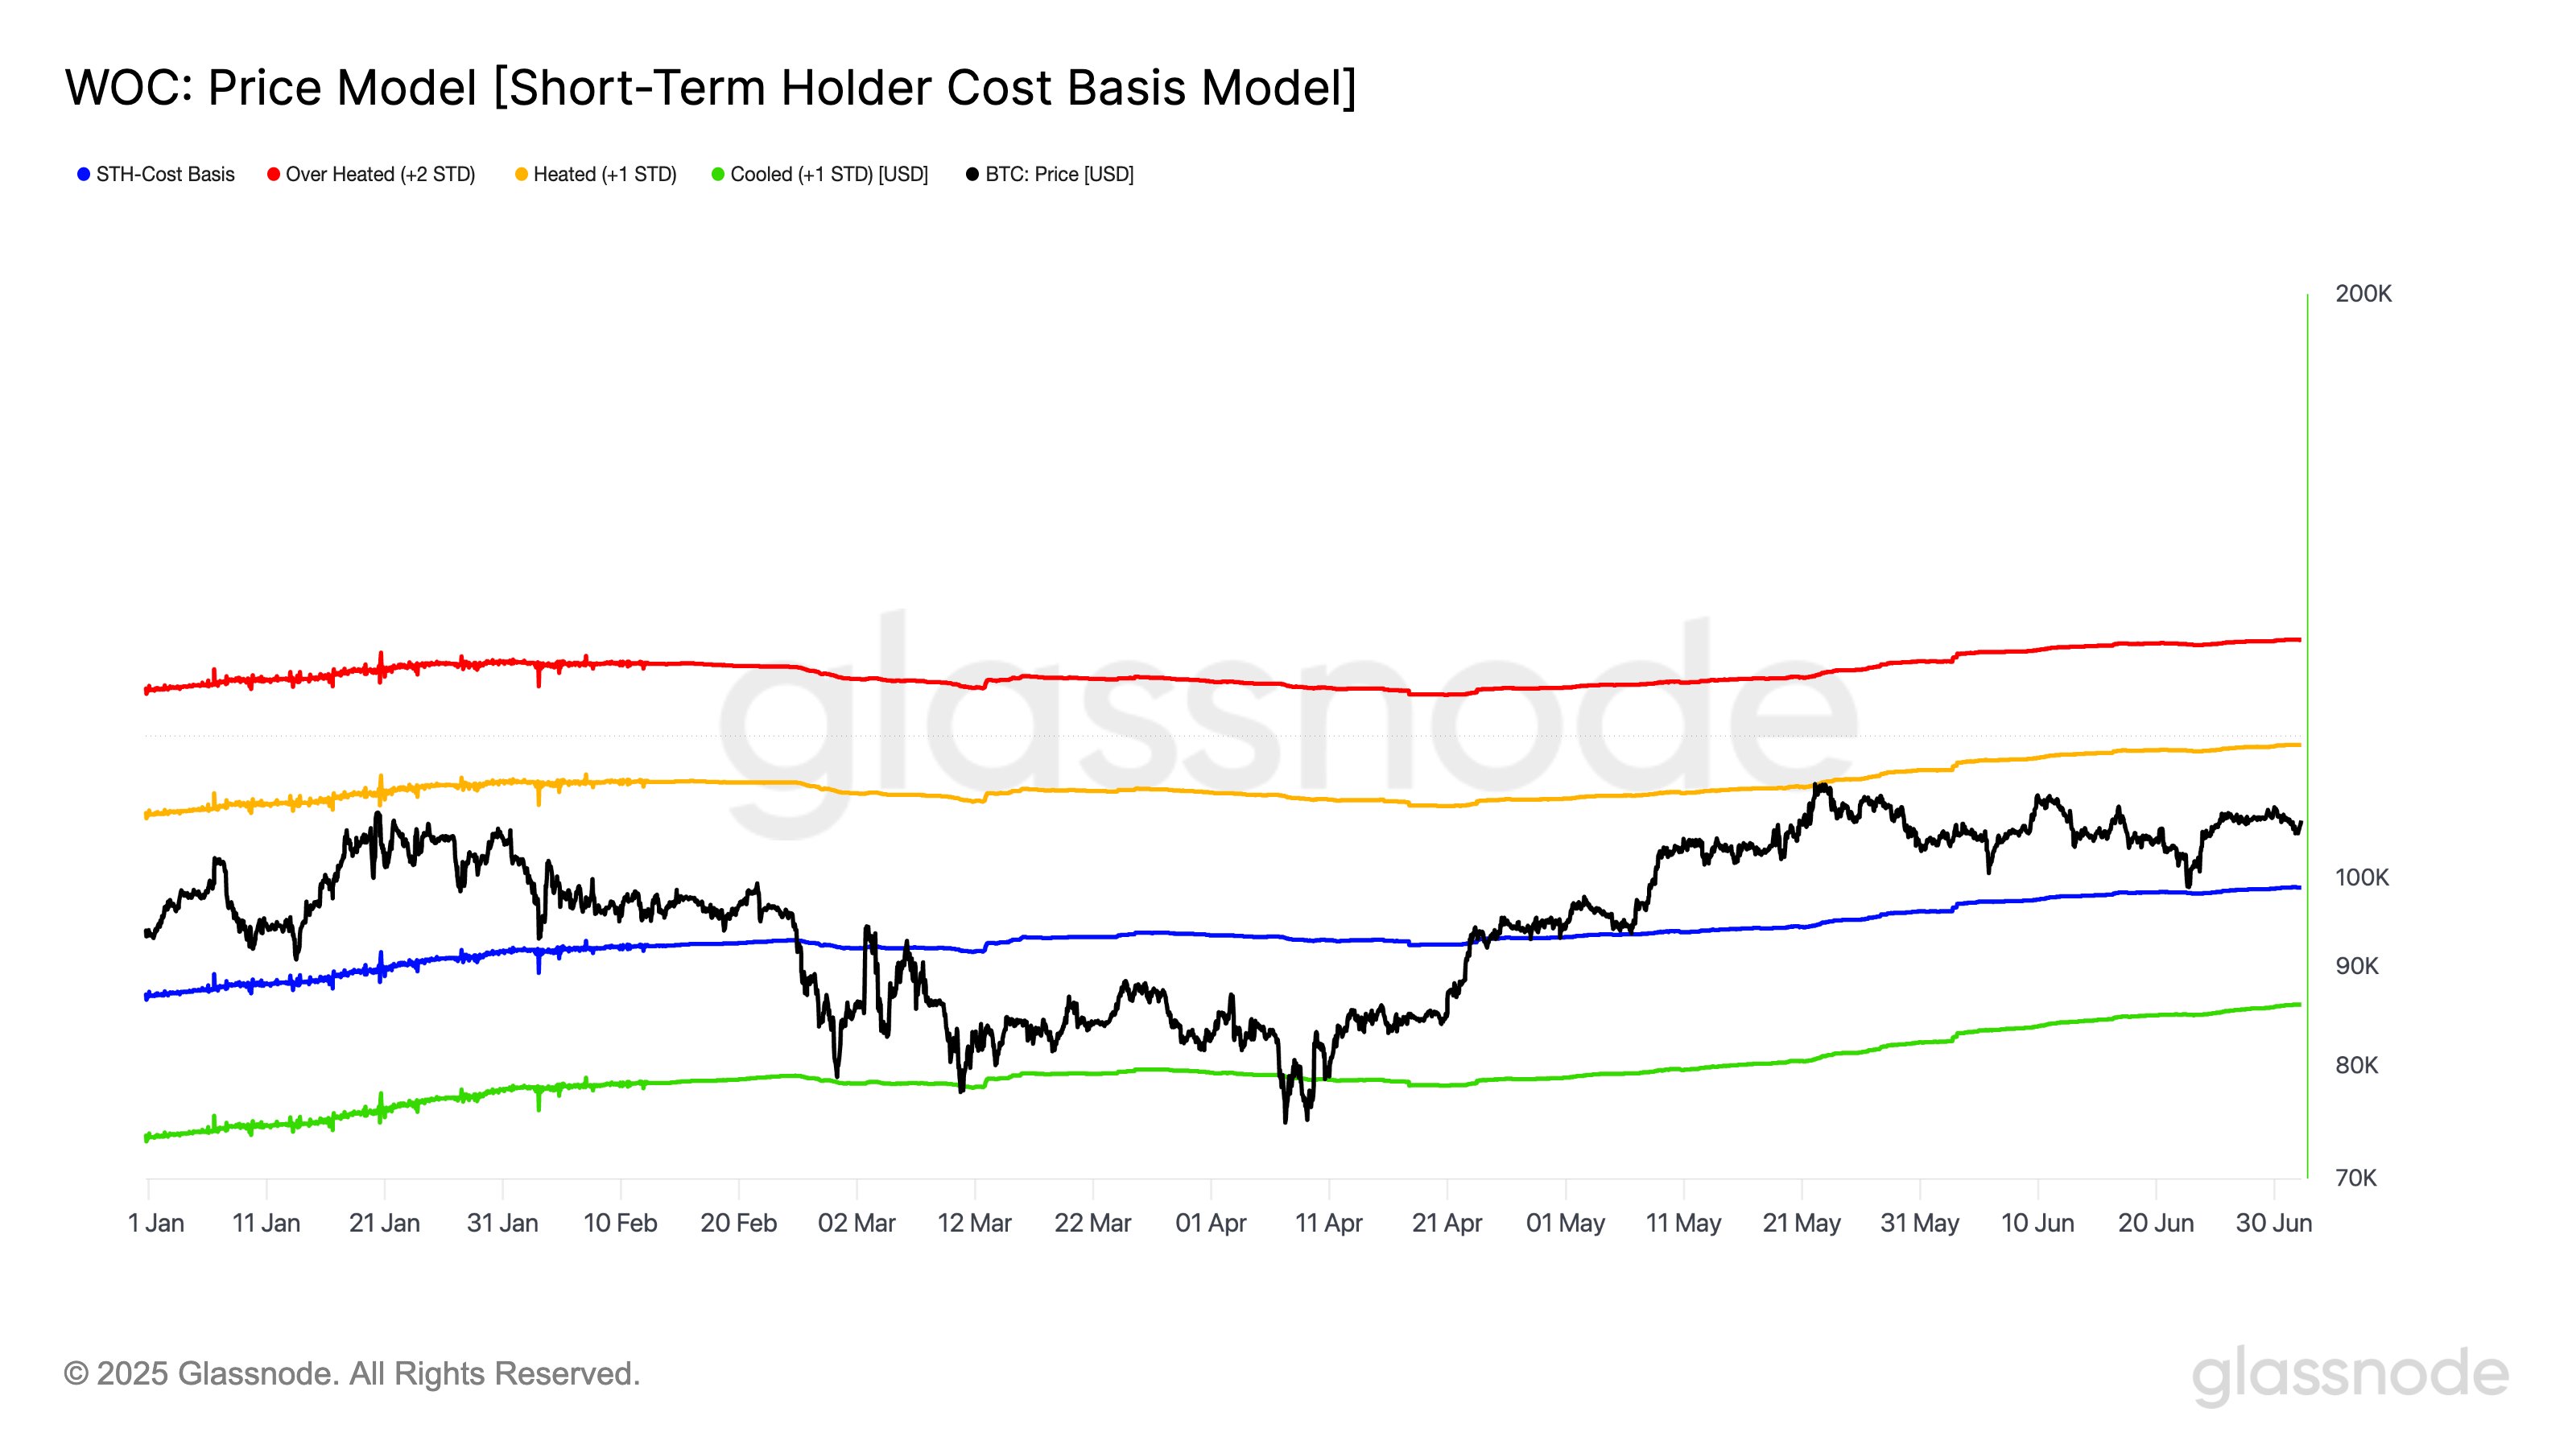
Bitcoin Short-Term Upper Bound Is $117,000, Glassnode Says
The on-chain analytics firm Glassnode has revealed Bitcoin has recently been trading within a short-...
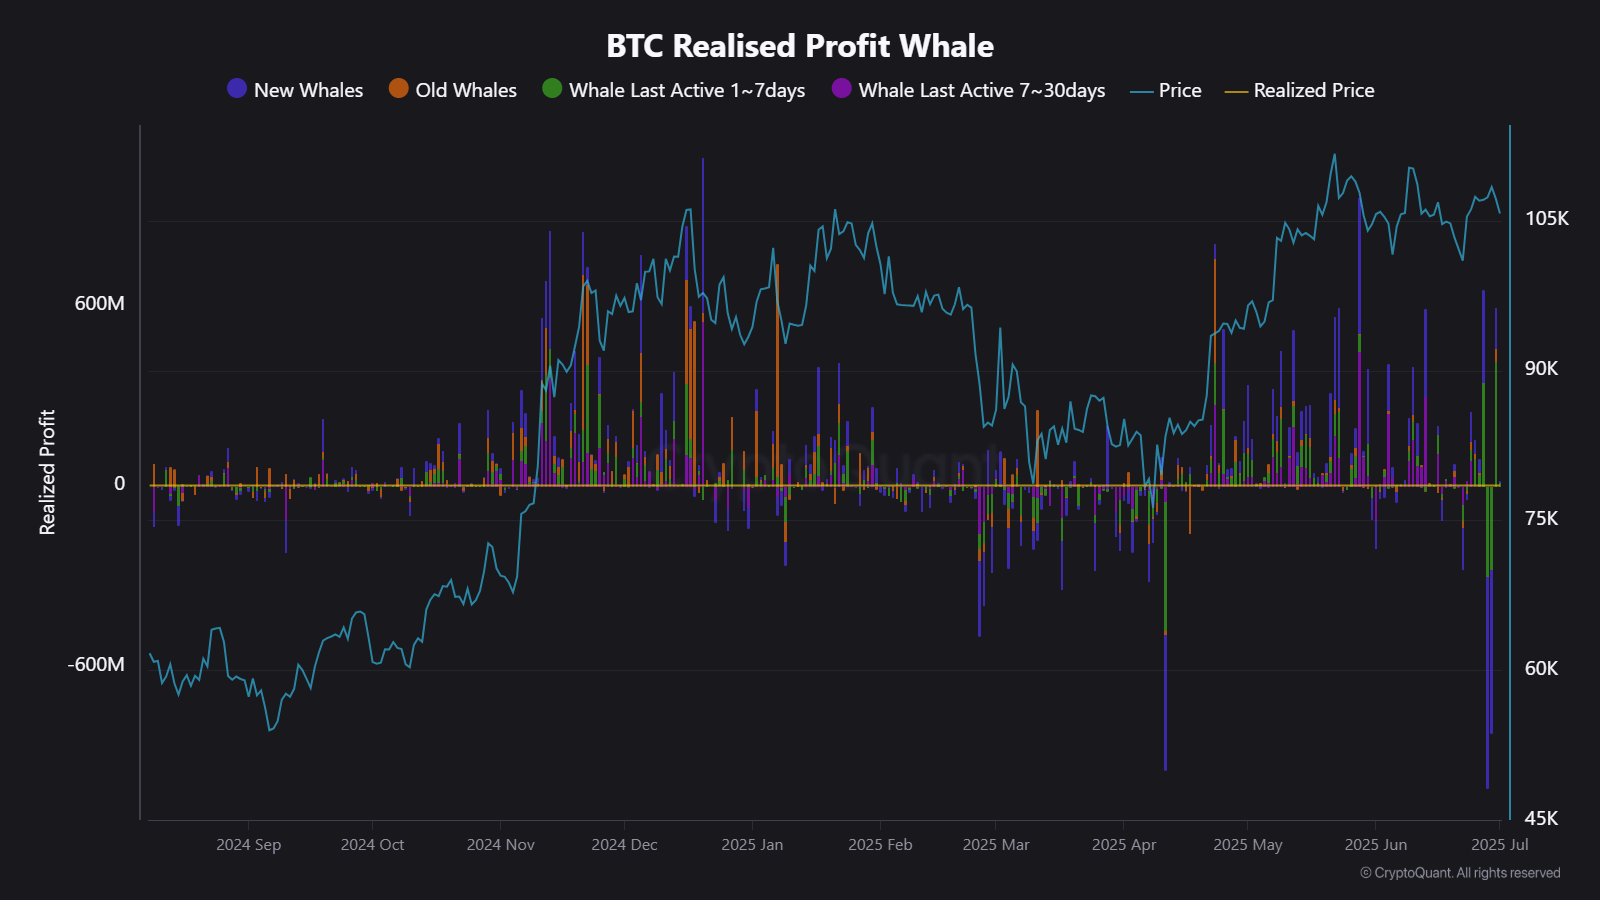
Whales Are Quietly Repositioning, Here’s What Bitcoin’s $107K Price Isn’t Telling You
Bitcoin continues to show little upward momentum as it trades below the $110,000 mark. As of the tim...
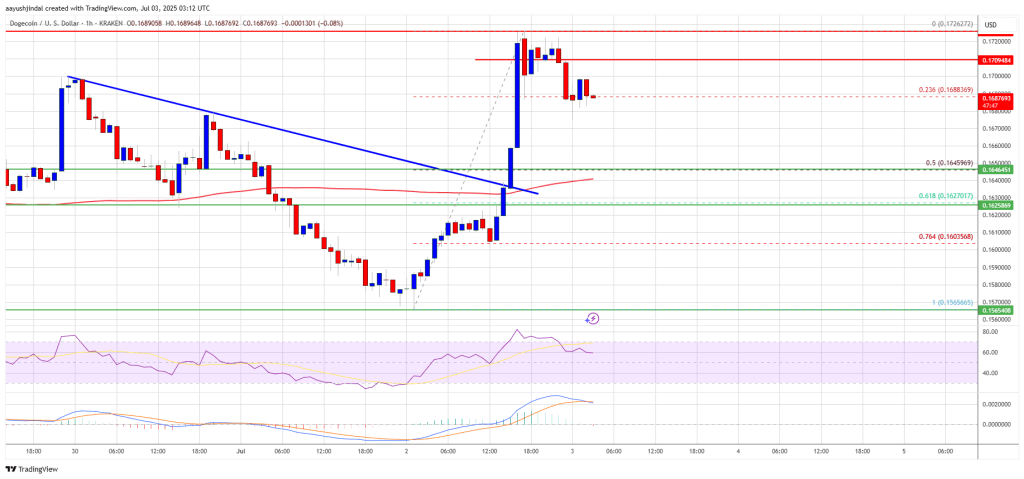
Dogecoin (DOGE) Bounces Off Lows, But $0.180 Cap Remains A Challenge
Dogecoin started a fresh increase above the $0.1650 zone against the US Dollar. DOGE is now consolid...