A widespread chart highlighting Bitcoin’s close relationship with the global M2 money supply suggests that Bitcoin could still rally extensively.
Bitcoin reclaimed $108,000 on Wednesday, continuing its resurgence from last week’s drop below $100,000. The recent push, which has pulled its market dominance to a 4.5-year high and left altcoins in the dust, has seen it extend its year-to-date gains to 15.53%, the largest among the top 10 assets by market cap.
Bitcoin’s Correlation with the M2 Money Supply
Meanwhile, while Bitcoin has outperformed most altcoins, a comparison of its price action against the global M2 money supply shows there is still room for more upside. Julien Bittel, the head of macro research at Global Macro Investor (GMI), highlighted this trend in a Wednesday, June 25, tweet.
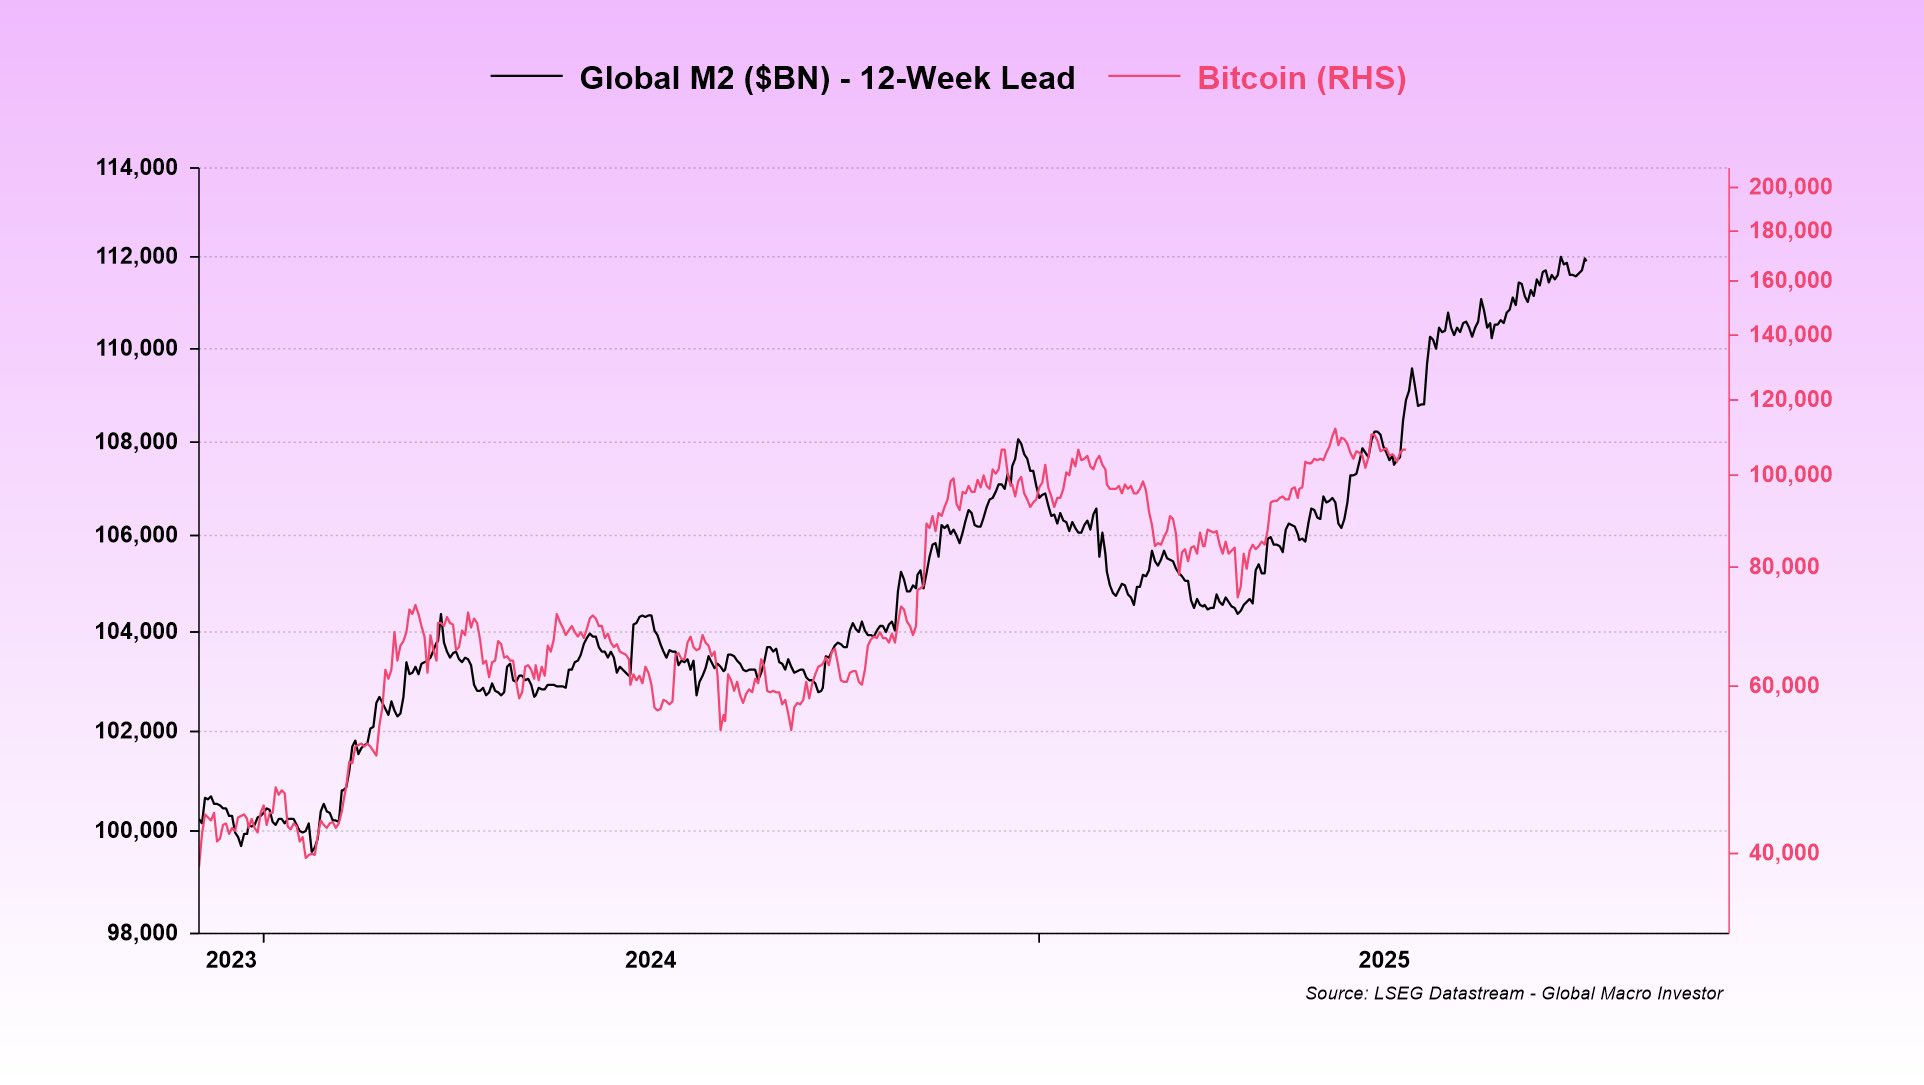
He shared the updated version of “the most copied Bitcoin chart on the planet” in the tweet, which highlighted a clear difference in the trajectory between Bitcoin and the global M2 12-week lead. For the uninitiated, the M2 monetary supply tracks the amount of money available for spending and investing in the global economy.
Bitcoin and Global M2 12-Week Lead Chart
It comprises liquidity from M1, which is physical cash, savings deposits, money market funds, and other forms of cash readily available for economic activities. Typically, a growth in global liquidity usually translates to an increase in investment appetite, favoring assets like Bitcoin.
Essentially, Bittel’s chart shows a close correlation between
Bitcoin
and the M2 money supply. The two have closely followed each other’s trends since 2023. While they have occasionally decoupled, their relationship has remained largely intact.
Bitcoin Still Lagging Against Global M2
According to data, the global M2 liquidity stands at $94.3 trillion. Notably, the figures have been growing extensively lately, following quantitative easing in some major economies globally and money printing by the central banks of certain countries.
The chart shows that the global M2 has outgrown Bitcoin, suggesting that the crypto leader could follow its lead, considering their close correlation. Meanwhile, Bittel emphasized that the analysis is not about Bitcoin matching the global liquidity tick for tick, but rather an indication that the bullish momentum for BTC remains intact.
This suggests that Bitcoin could trend higher from current prices, potentially surpassing its all-time high of $112,000. While the analyst did not mention a precise target, earlier outlooks predict prices of $175,000,
$200,000
, and $250,000 by the end of the cycle.
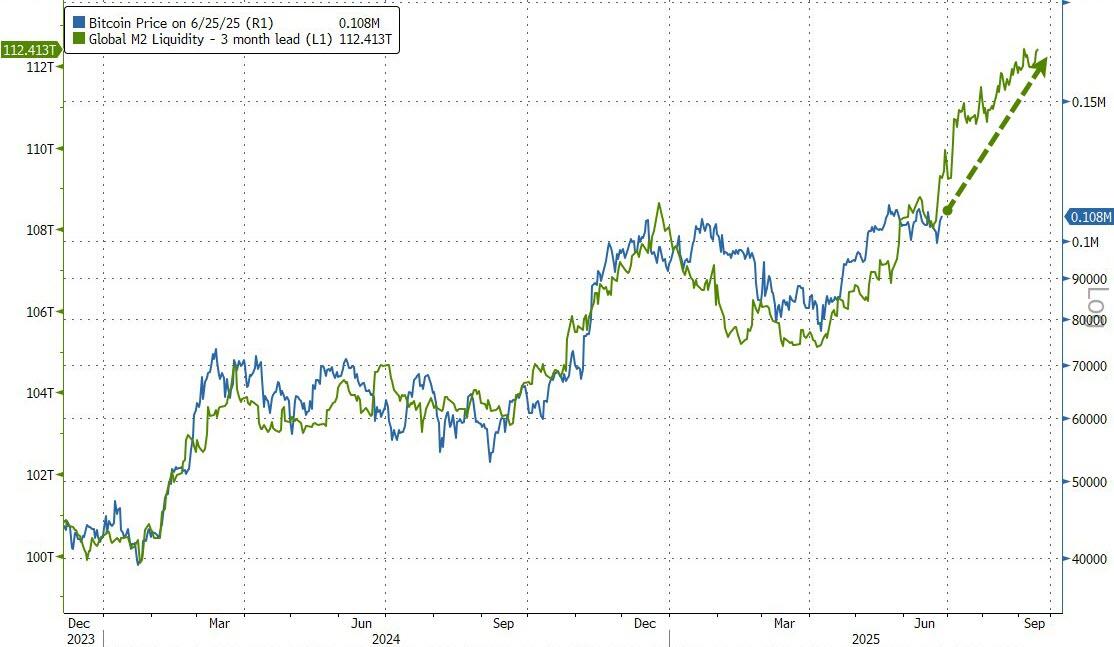
Moreover, analysis from Zero Hedge supports Bittel’s outlook. An accompanying
chart
also shows a correlation between Bitcoin and the global M2, suggesting that BTC may rally extensively from its current prices to close a highlighted performance gap.
Bitcoin vs Global M2 Liquidity/ZeroHedge
Analyst Sina Issues Reality Check
In response to the trending chart, Sina identified what he described as data illiteracy. He highlighted in a tweet about a consistent data tweak among analysts to arrive at the perfectly trimmed correlation.
Furthermore, he identified a measurement problem and an overfitting by analysts to model “noise,” hence the close correlation. While he agreed that Bitcoin has a correlation with the global M2, he believes the circulating charts do not accurately portray their relationship.
Recall that Sina
predicted
that Bitcoin would hit $285,000 this year, citing the quantile model. At the time of writing, Bitcoin trades at $107,446.
Disclaimer: This article is copyrighted by the original author and does not represent MyToken’s views and positions. If you have any questions regarding content or copyright, please contact us.(www.mytokencap.com)contact