XRP Price Trades Sideways — Bulls Preparing for Next Push?


XRP price started a fresh increase from the $2.150 zone. The price is consolidating gains and might aim for a move above the $2.220 zone.
- XRP price started a fresh increase above the $2.150 zone.
- The price is now trading above $2.150 and the 100-hourly Simple Moving Average.
- There is a bullish trend line forming with support at $2.1320 on the hourly chart of the XRP/USD pair (data source from Kraken).
- The pair could continue to move up if it closes above the $2.220 resistance zone.
XRP Price Eyes Upside Break
XRP price remained supported and started a fresh increase above the $2.050 zone, like Bitcoin and Ethereum . The price recovered above the $2.080 and $2.120 resistance levels.
The pair even cleared the $2.180 resistance and recently spiked above the $2.220 zone. A high was formed at $2.2294 and the price is now consolidating gains above the 23.6% Fib retracement level of the upward move from the $1.910 swing low to the $2.2294 high.
The price is now trading above $2.180 and the 100-hourly Simple Moving Average. Besides, there is a bullish trend line forming with support at $2.1320 on the hourly chart of the XRP/USD pair.
On the upside, the price might face resistance near the $2.220 level. The first major resistance is near the $2.250 level. The next resistance is $2.320. A clear move above the $2.320 resistance might send the price toward the $2.40 resistance.
Any more gains might send the price toward the $2.480 resistance or even $2.50 in the near term. The next major hurdle for the bulls might be $2.550.
Downside Correction?
If XRP fails to clear the $2.220 resistance zone, it could start another decline. Initial support on the downside is near the $2.150 level. The next major support is near the $2.1320 level and the trend line.
If there is a downside break and a close below the $2.1320 level, the price might continue to decline toward the $2.050 support or the 50% Fib retracement level of the upward move from the $1.910 swing low to the $2.2294 high. The next major support sits near the $2.00 zone.
Technical Indicators
Hourly MACD – The MACD for XRP/USD is now gaining pace in the bullish zone.
Hourly RSI (Relative Strength Index) – The RSI for XRP/USD is now above the 50 level.
Major Support Levels – $2.150 and $2.1320.
Major Resistance Levels – $2.220 and $2.250.
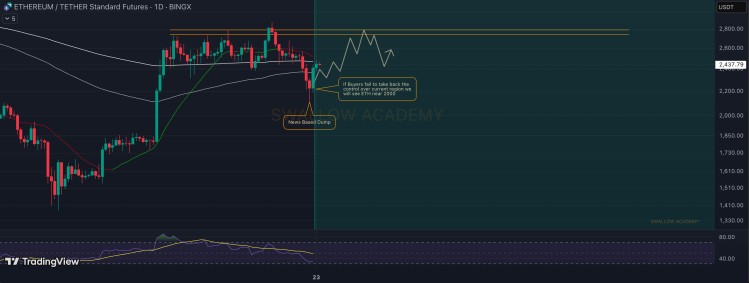
The Ethereum Waiting Game: Breakout To $2,800 Or Crash To $2,000?
After suffering a major price crash back during the weekend, the Ethereum price has enjoyed an over ...
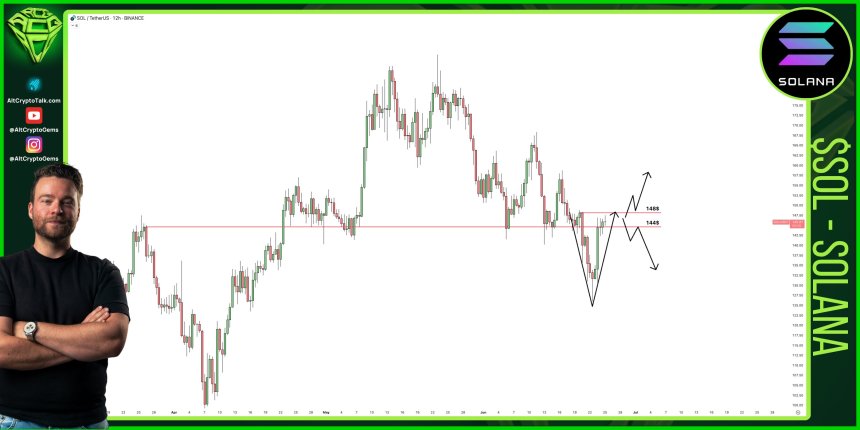
Solana Price At ‘A Very Delicate Level’ – Analyst Says $148 Reclaim Is Key
Despite recovering from the weekend retrace, Solana (SOL) is trading between two levels that could m...
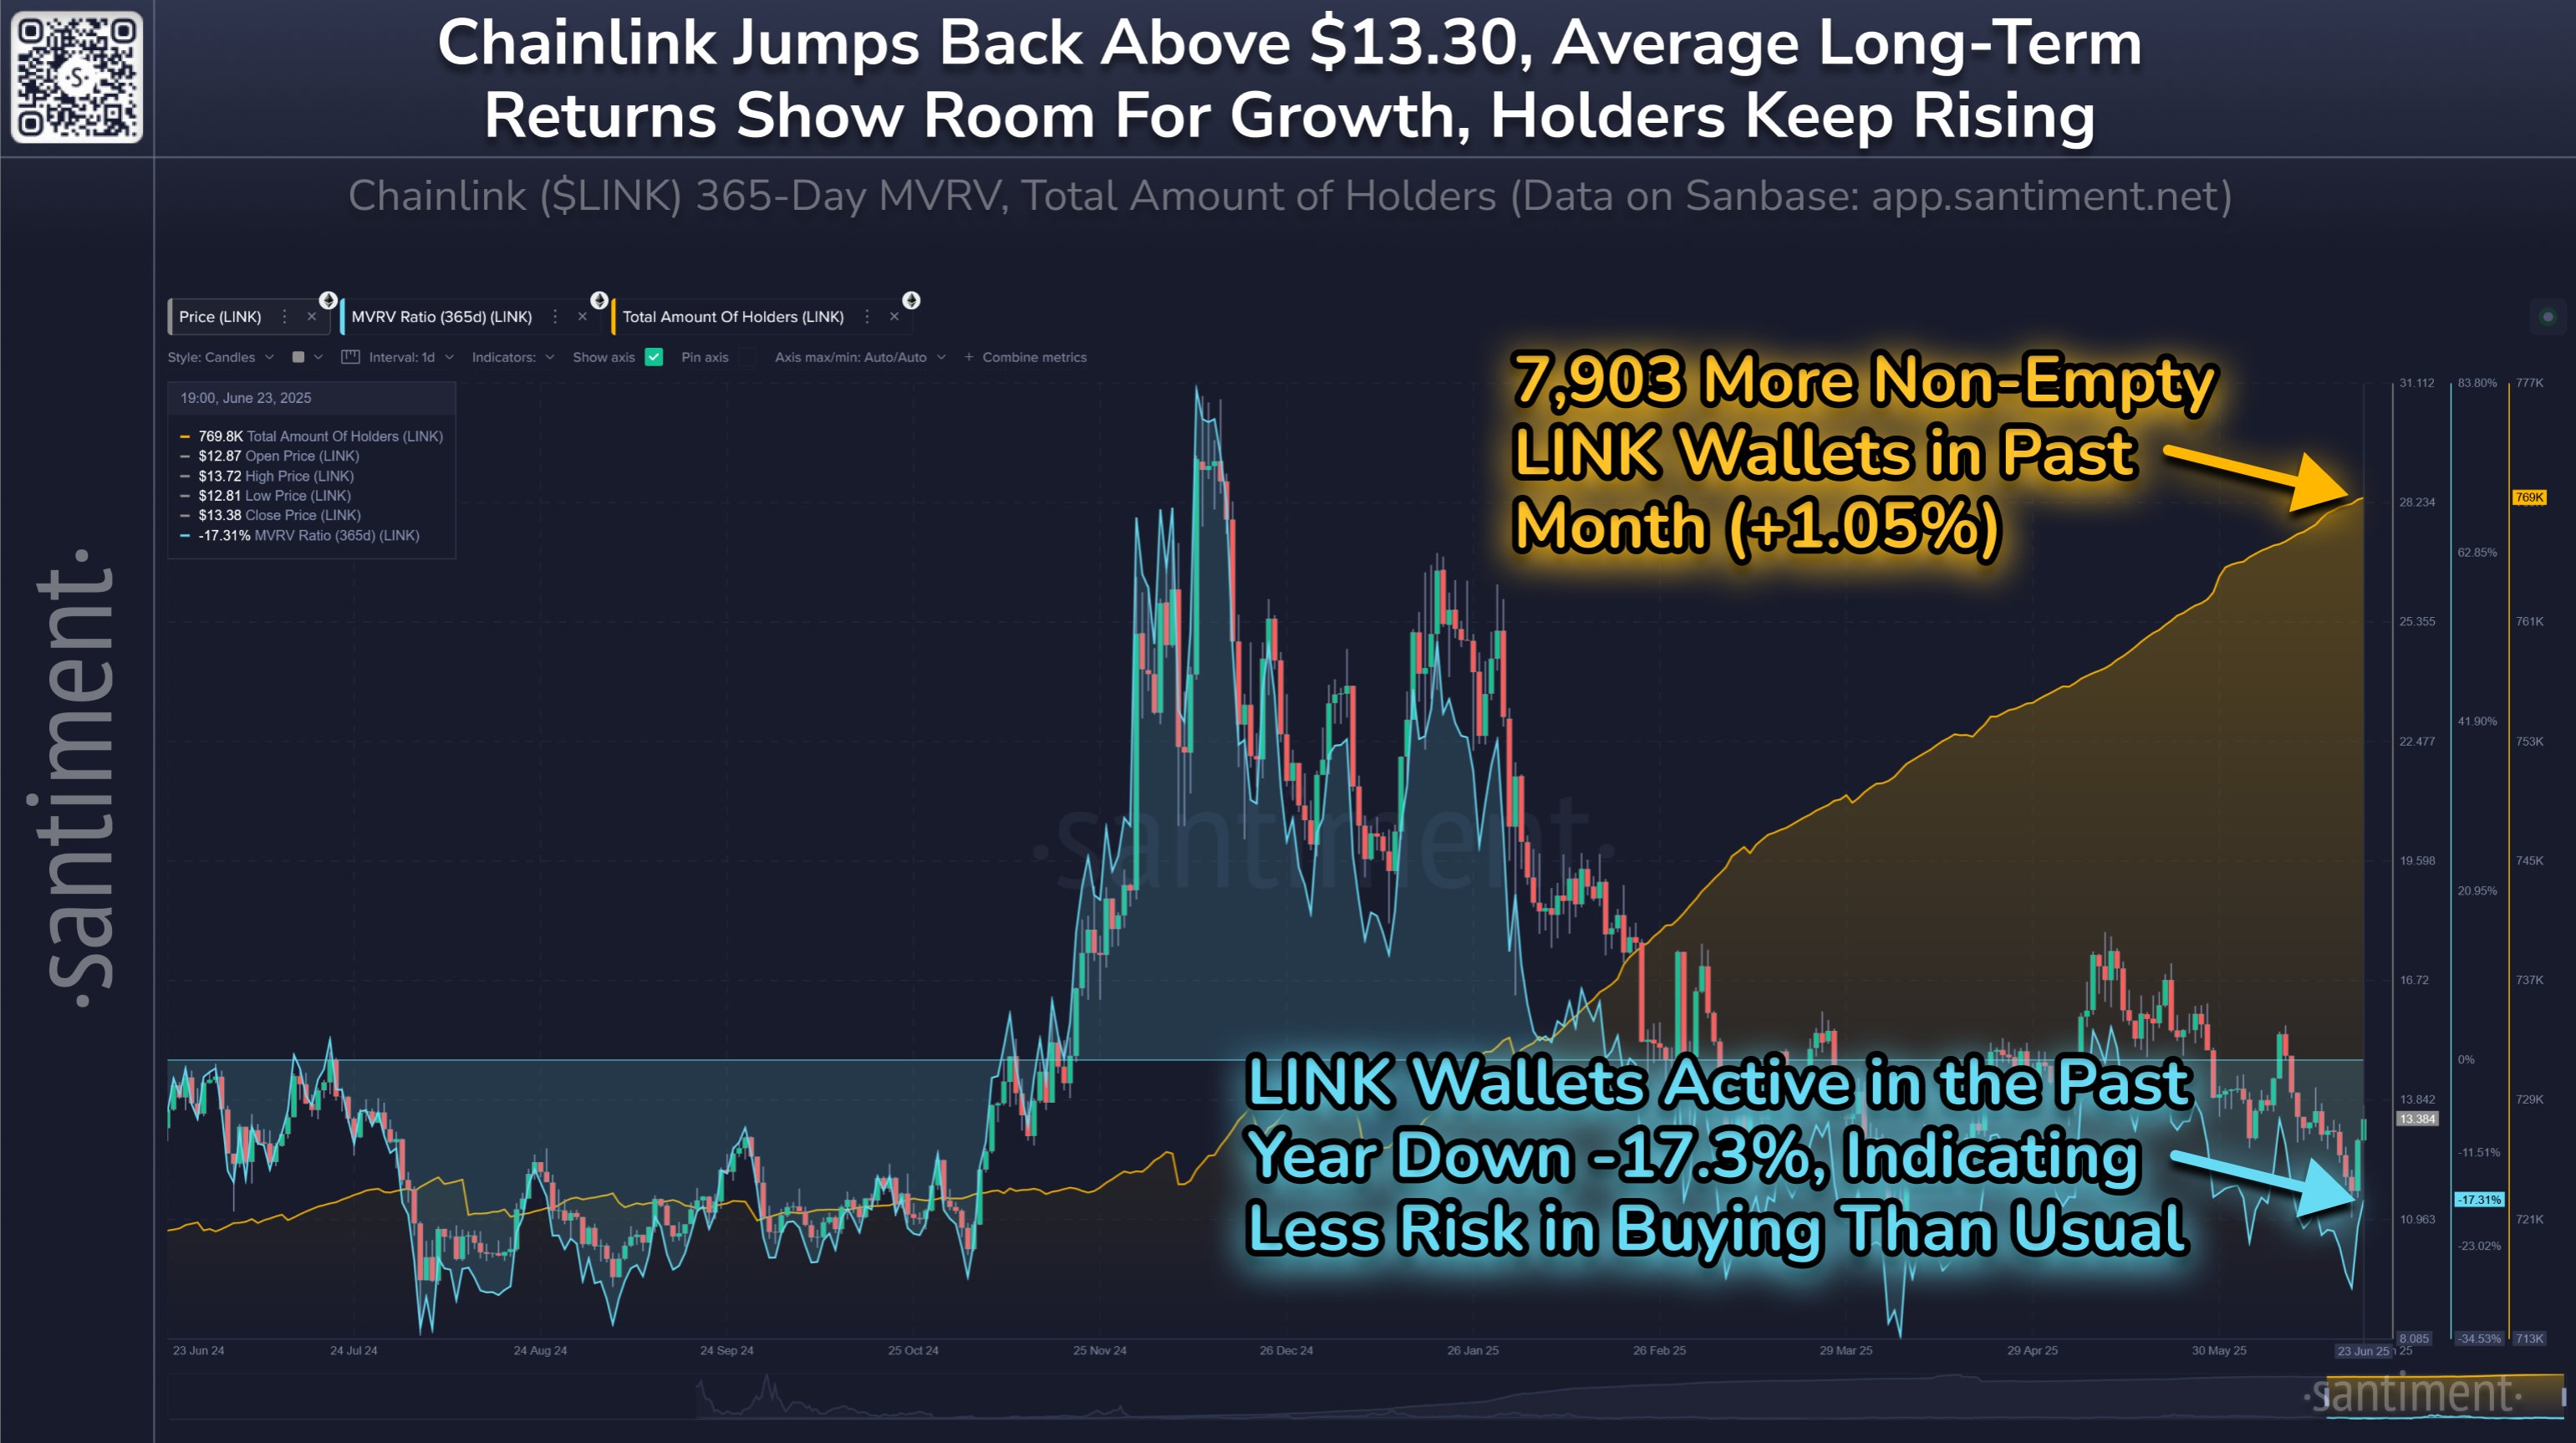
Chainlink Holders Set Record As 1-Yr MVRV Signals ‘Opportunity’
On-chain data shows new investors have been coming into Chainlink (LINK) as the MVRV Ratio signals a...