Bitcoin Price Struggles to Reclaim Resistance — Sideways Action Dominates


Bitcoin price started a fresh decline below the $106,200 zone. BTC is now consolidating and facing resistance near the $105,500 zone.
- Bitcoin started a fresh decline below the $106,000 zone.
- The price is trading below $106,000 and the 100 hourly Simple moving average.
- There is a key bearish trend line forming with resistance at $105,200 on the hourly chart of the BTC/USD pair (data feed from Kraken).
- The pair could start a fresh increase if it stays above the $103,500 zone.
Bitcoin Price Starts Consolidation
Bitcoin price started a fresh decline below the $108,000 zone. BTC gained pace and dipped below the $107,000 and $106,000 levels.
There was a clear move below the $105,500 support level. Finally, the price tested the $103,500 zone. A low was formed at $103,400 and the price started a minor recovery wave. There was a move above the 23.6% Fib retracement level of the downward move from the $108,924 swing high to the $103,400 low.
However, the bears were active below the $105,500 zone. Bitcoin is now trading below $105,500 and the 100 hourly Simple moving average . There is also a key bearish trend line forming with resistance at $105,200 on the hourly chart of the BTC/USD pair.
On the upside, immediate resistance is near the $105,200 level. The first key resistance is near the $105,500 level. The next key resistance could be $106,150. It is near the 50% Fib retracement level of the downward move from the $108,924 swing high to the $103,400 low.
A close above the $106,150 resistance might send the price further higher. In the stated case, the price could rise and test the $108,800 resistance level. Any more gains might send the price toward the $110,000 level.
Another Decline In BTC?
If Bitcoin fails to rise above the $105,500 resistance zone, it could start another decline. Immediate support is near the $104,200 level. The first major support is near the $103,500 level.
The next support is now near the $102,650 zone. Any more losses might send the price toward the $101,200 support in the near term. The main support sits at $100,000, below which BTC might gain bearish momentum.
Technical indicators:
Hourly MACD – The MACD is now losing pace in the bearish zone.
Hourly RSI (Relative Strength Index) – The RSI for BTC/USD is now near the 50 level.
Major Support Levels – $104,200, followed by $103,500.
Major Resistance Levels – $105,500 and $106,200.
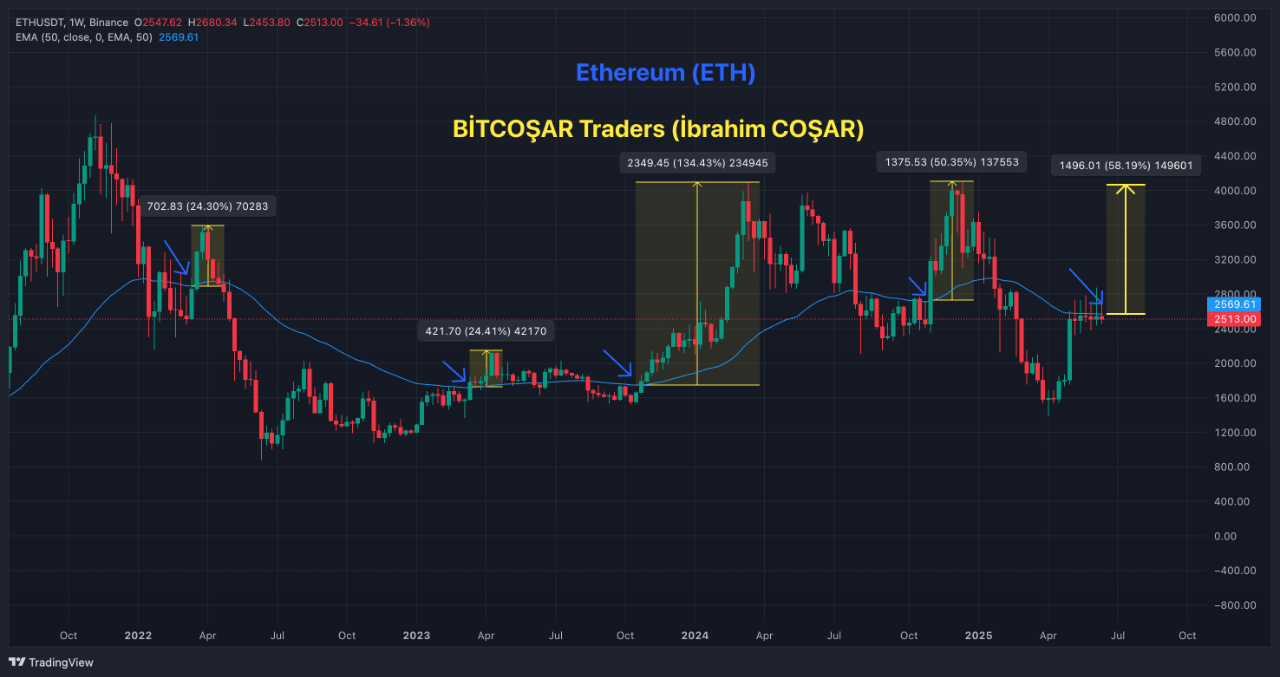
Ethereum Stalls at $2,500, But Is a $4,000 Breakout Closer Than You Think?
Ethereum has struggled to maintain upward momentum following a brief rally that pushed its price abo...
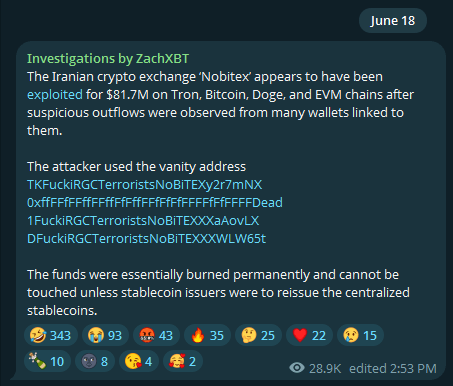
Iran’s Top Crypto Hub Loses $82 Million To Hackers With Israeli Links—Details
An onchain investigator has flagged a major breach at Iran-based Nobitex, where hackers made off wit...
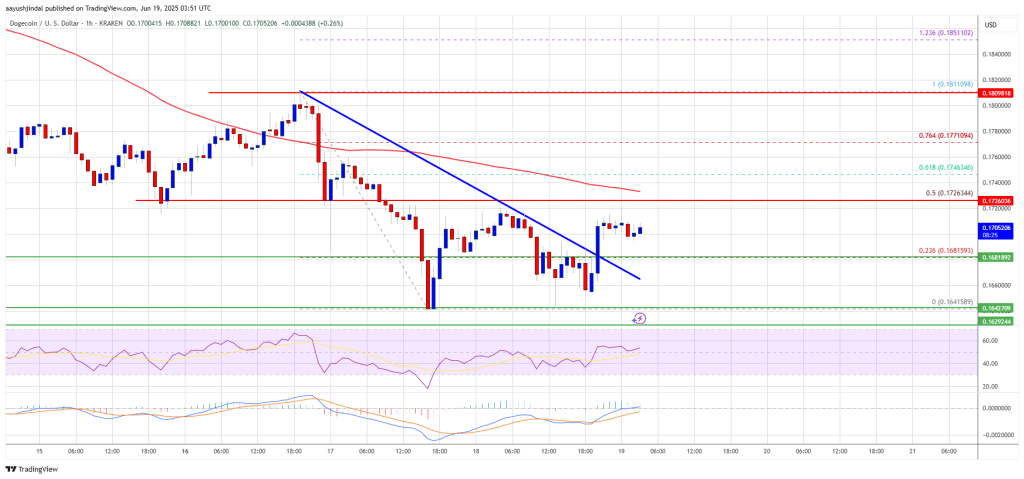
Dogecoin (DOGE) Struggles to Climb — Upside Moves Likely to Face Strong Resistance
Dogecoin started a fresh decline from the $0.1820 zone against the US Dollar. DOGE is now consolidat...