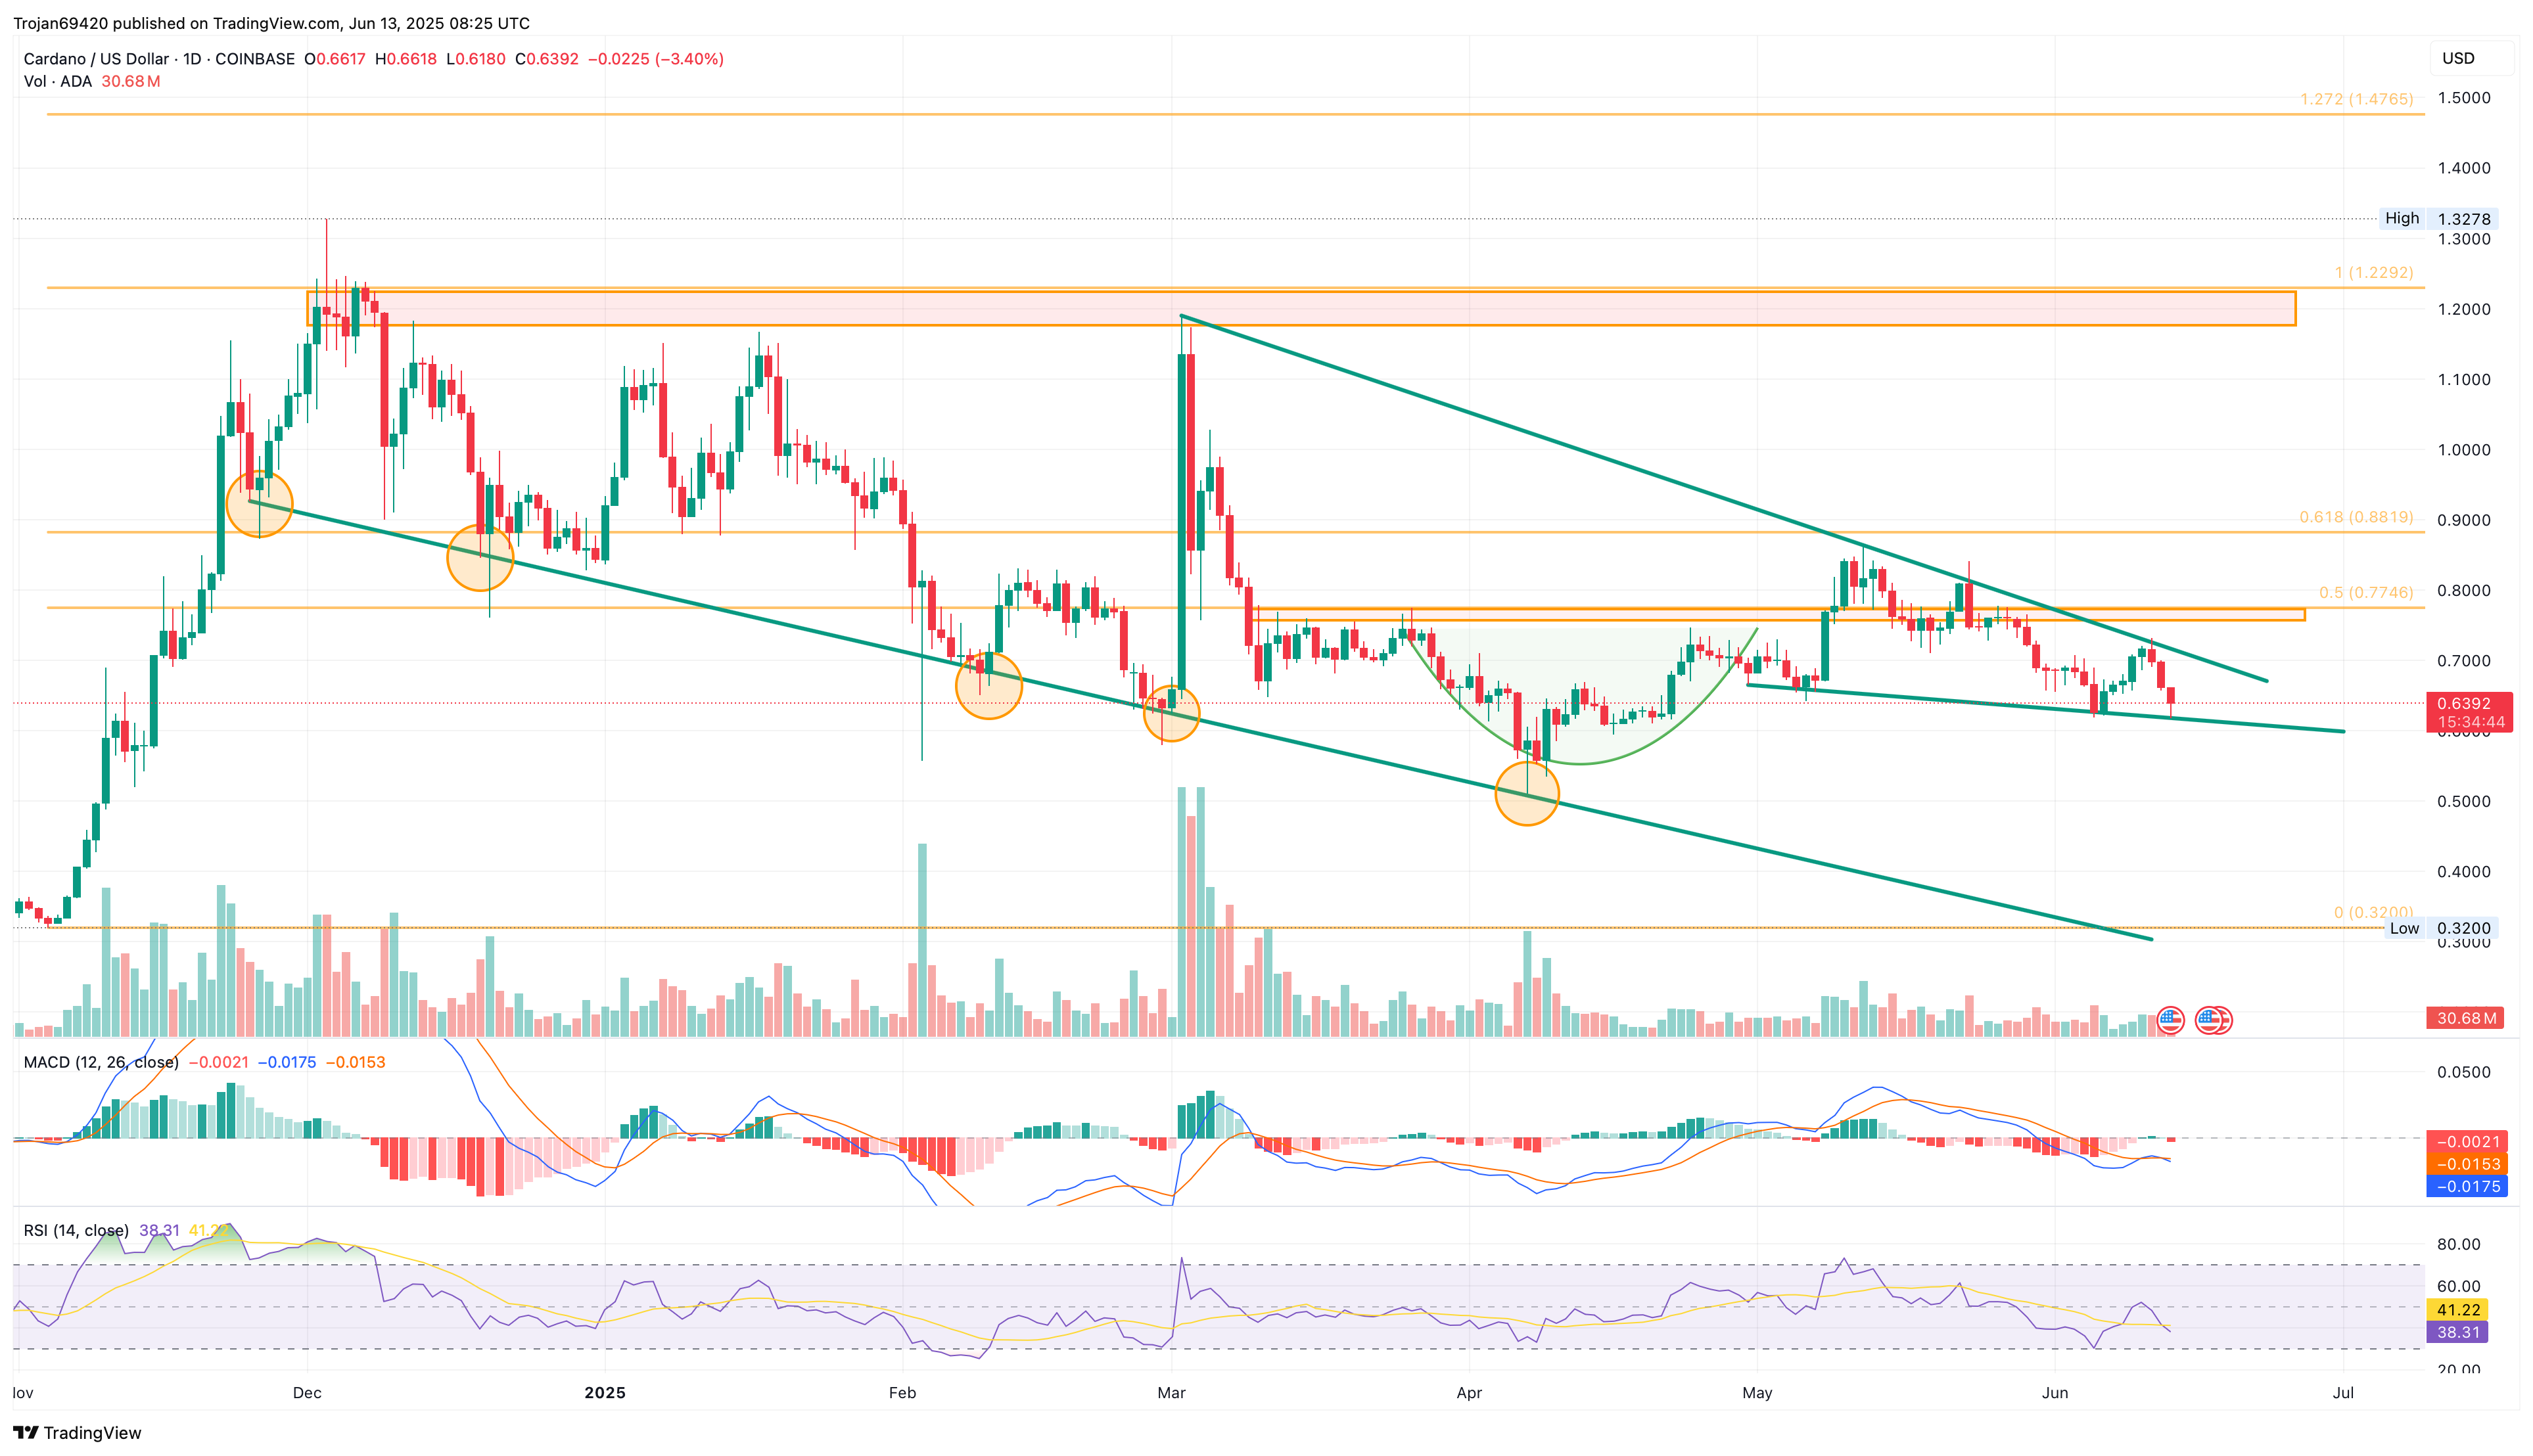
Cardano is trading near $0.63 amid a falling wedge setup. A breakdown could push ADA to $0.50, while a reversal may target $0.77.
Amid the broader market downturn,
Cardano
faces the risk of a potential breakdown from a falling wedge pattern. With declining optimism in the derivatives market, ADA may be heading toward the psychological $0.50 level.
Cardano Price Analysis
On the daily chart, Cardano shows a failed bullish attempt to break above a local resistance line, resulting in three consecutive bearish candles. Currently, ADA is trading at $0.6392, with an intraday drop of 3.40%, testing a local support trendline.
Cardano Price Chart
Notably, two converging trendlines on the daily chart form a falling wedge pattern. The current intraday candle shows a minor lower wick, suggesting a potential reversal.
However, the recent pullback has intensified bearish pressure, reflected in momentum indicators. The MACD and signal lines have shifted into a bearish alignment, accompanied by a fresh red histogram on the daily chart.
Similarly, the RSI has dropped to 38, approaching the oversold zone, suggesting weakening bullish momentum. Together, these indicators warn of a potential breakdown if bearish momentum continues.
A close below the support trendline would significantly increase the likelihood of Cardano retesting the $0.50 psychological level.
Conversely, a bullish breakout from the falling wedge, initiated by a rebound from the support trendline, could push ADA toward the 50% Fibonacci retracement level at $0.7746.
ADA Derivatives
Cardano’s open interest has declined by 6.16% over the past 24 hours, indicating a sharp drop in trader optimism. As of now, open interest stands at $792.61 million, while the OI-weighted funding rate has flipped into negative territory at -0.0132%.
Cardano Derivatives
Cardano Derivatives
This shift suggests a notable surge in bearish activity over the last 8 hours, primarily driven by increased long liquidations. According to available data, long liquidations total $6.97 million, compared to just $131K in short liquidations, signaling a significant wipeout of bullish positions.
As a result, the long-to-short ratio has dropped to 0.9033 in the past 24 hours, reflecting a bearish outlook among derivatives traders.
Disclaimer: This article is copyrighted by the original author and does not represent MyToken’s views and positions. If you have any questions regarding content or copyright, please contact us.(www.mytokencap.com)contact