Bitcoin Options Traders Expect Quiet—But On-Chain Data Suggests Chaos


The Bitcoin Options traders have been pricing in low implied volatility, but on-chain data shows a setup ripe for amplified price swings.
Bitcoin Options ATM IV Has Been Trending Lower
In its latest weekly report, the analytics firm Glassnode has talked about how the volatility risk associated with Bitcoin looks from the perspective of on-chain analysis.
The indicator shared by Glassnode is the Realized Supply Density, which tells us about how concentrated the cryptocurrency’s supply is around the current spot price.
When the value of this metric is high, it means the investors have participated in a large amount of buying at or near the asset’s latest price. “In such environments, even modest price fluctuations can affect a broad swath of investors, often amplifying market sensitivity and, in turn, volatility potential,” explains the analytics firm.
Below is the chart for the indicator shared by in the report.

As is visible in the graph, the Bitcoin Realized Supply Density has gone through an uplift during the past few weeks, which suggests accumulation has taken place around the current spot price. “This concentration raises the probability of outsized reactions to price movements, increasing volatility risk in the near term,” notes Glassnode.
While on-chain data may hint that volatility could go up in the future, it would appear the traders on the Options market don’t quite think the same, as the At-The-Money Implied Volatility (ATM IV) has been going down.
The IV is a metric that represents the traders’ expectations of how volatile Bitcoin will be over a given period, based on the pricing of Options contracts. The ATM version of the indicator specifically calculates this expectation based on Options closest to the latest spot price.
Here is a chart that shows the trend in the Bitcoin Options ATM IV across different expiration timeframes:

From the above graph, it’s apparent that the Bitcoin Options ATM IV has been going down for all major tenors, an indication that the traders don’t expect high volatility for the cryptocurrency in the near future.
“Historically, such complacency in volatility pricing has often served as a counter-trend signal, preceding periods of heightened volatility,” says the analytics firm. With on-chain data suggesting increased volatility risk and this signal forming at the same time, it now remains to be seen how Bitcoin would develop in the coming days.
BTC Price
At the time of writing, Bitcoin is trading around $108,800, up more than 3.5% in the last week.

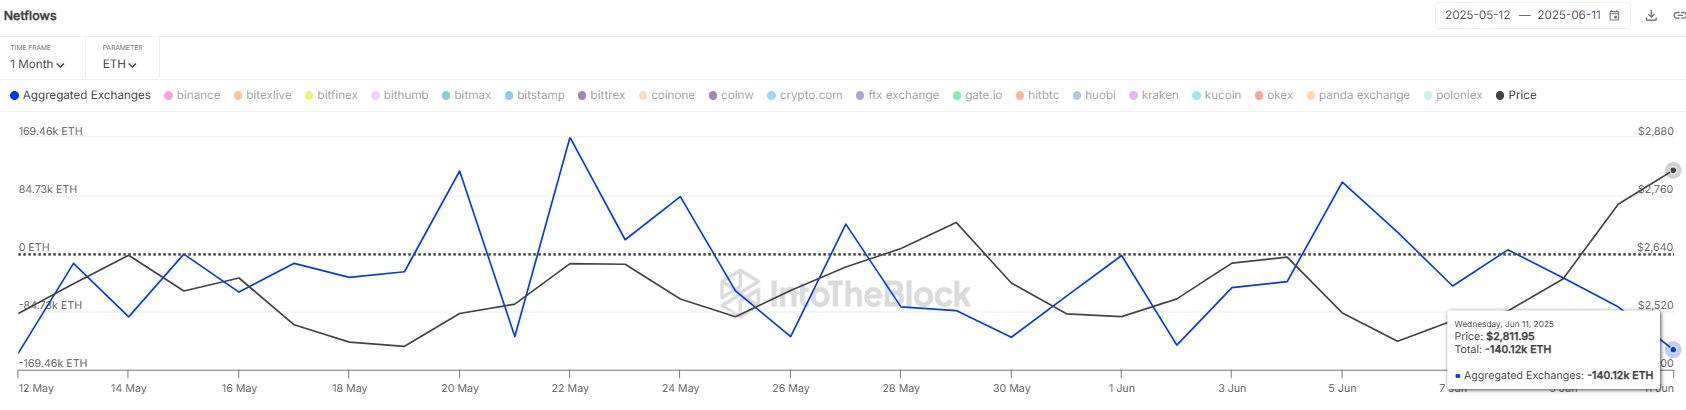
$390M In Ethereum Leaves Exchanges—Biggest Daily Exit In Over A Month
On-chain data shows Ethereum has just witnessed its largest daily withdrawal in over a month, a sign...

Bitcoin Is Just 0.2% Of Global Wealth — And That’s Why It’s Not Too Late: Analyst
According to Walker, host of The Bitcoin Podcast, Bitcoin’s share of the world’s wealth is still tin...

Bitcoin Could Jump 20% For Every 1% Liquidity Boost: Expert
Bitcoin’s blistering second-quarter advance is tracking the strongest expansion in global liquidity ...