Hyperliquid, HYPE Hits EMA Support At $30 — Rally Paused After 326% Surge


The post Hyperliquid, HYPE Hits EMA Support At $30 — Rally Paused After 326% Surge appeared first on Coinpedia Fintech News
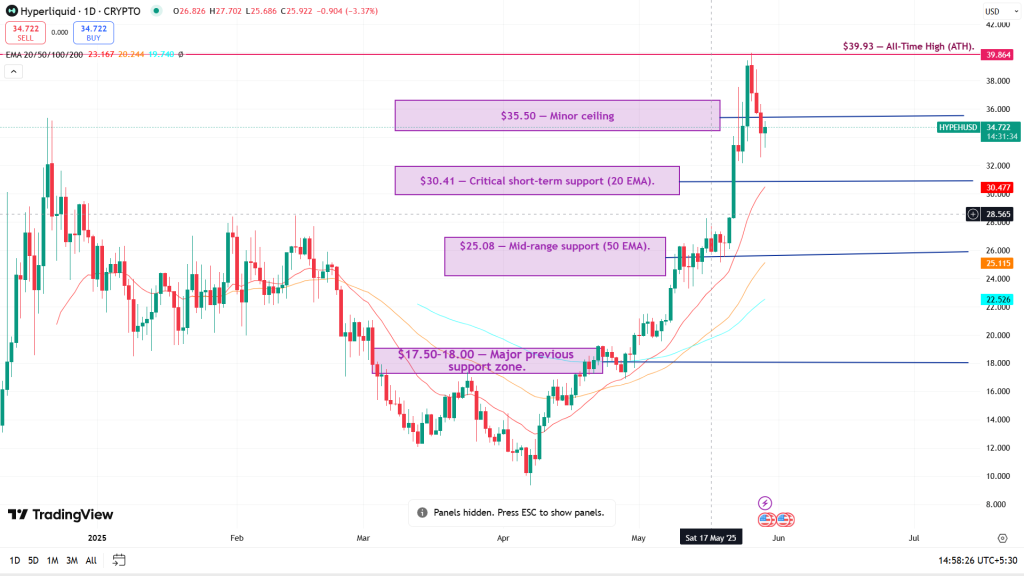
Hyperliquid (HYPE) saw a 326% rally from early April lows to a peak of $39.93 on May 26. While the macro trend remains bullish, short-term indicators suggest fading momentum. Price action is now centered around the $30–$35 zone — a key support battleground for bulls.
Key Highlights
- HYPE gained 326% since April, reaching an ATH of $39.93 before cooling to $34.74.
- Open interest broke above $10.1B, signaling intense leverage participation.
- TVL rose from $268.9M in early April to over $500M by May 29.
- Momentum remains bullish, but RSI and MACD suggest exhaustion near $35.50 resistance.
Why HYPE Hit ATH — And Why It’s Cooling Now
TradingView News stated that Hyperliquid’s rise to $39.93 was driven by institutional activity and increasing engagement.
As a top DeFi platform for perpetual trading, the platform’s weekly volume reached $78.67B (May 11–18), with a record $17.73B on May 21.
High-profile trader James Wynn’s billion-dollar positions brought attention, pushing open interest past $10.1B, confirmed by Blocmates. The platform also generated $5.6M in daily fees, showing heavy trading demand.
This surge in on-chain activity reflects a wider shift as traders increasingly favour decentralized venues offering deep liquidity, transparent execution, and non-custodial control over assets.
However, RSI and MACD now signal a cooldown, suggesting consolidation unless bulls reclaim resistance.
Hyperliquid Surpasses SUI in Market Cap.
Between May 25–26 , HYPE’s market cap peaked at $13.04B , overtaking SUI Coin $12.27B . The rally was backed by over $460M in daily volume , pushing HYPE into the top 12 crypto assets by market cap.
As of May 29, HYPE trades at $34.74 with a market cap of $11.46B , still ahead of SUI’s $12.03B, but with momentum clearly cooling.
HYPE/USD Ichimoku Cloud Analysis: Bulls Hold the Line — For Now
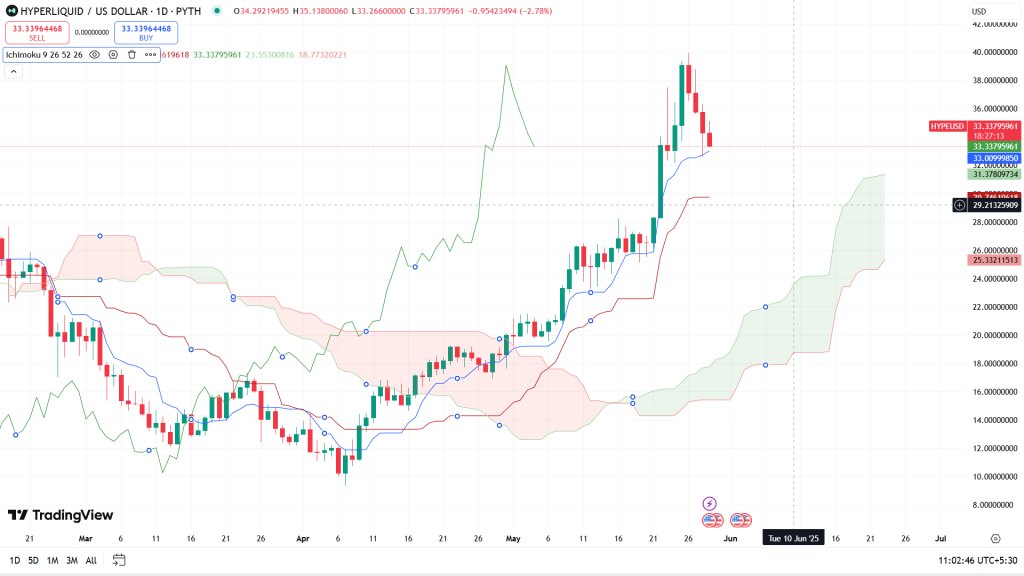
The daily Ichimoku Cloud shows a bullish structure, with price above the Kumo. Tenkan-sen ($33.0) is under pressure, with Kijun-sen ($31.3) below.
A break under the 20 EMA ($30.41) could shift short-term momentum.
Additional support sits at the 100 EMA ($27.38) and 50 EMA ($25.08). While the stack is still bullish, it shows vulnerability.
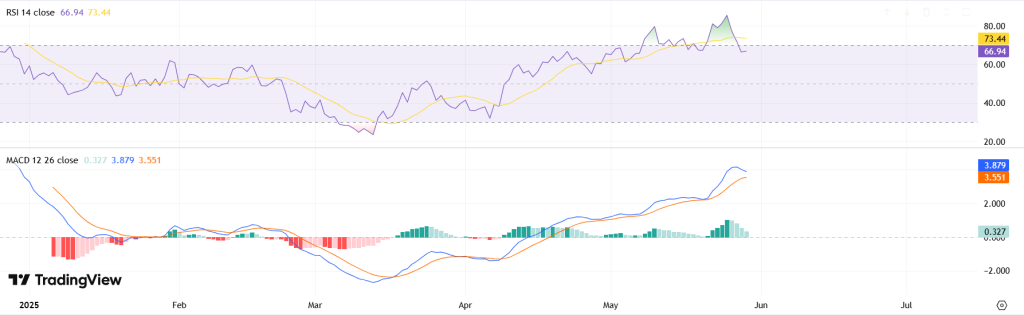
Momentum Indicators: Cooling, But Not Reversing
-
RSI (14)
: Down from 73.30 to
66.94
— still bullish, but no longer in overbought territory.
- MACD : Still above signal line, but histogram has begun to fade — a sign of slowing momentum.
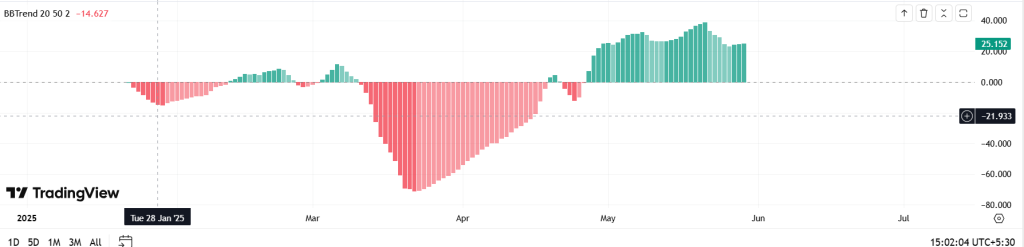
- BBTrend : Flattening near 25.15 from 38.863 , indicating the breakout momentum is cooling.
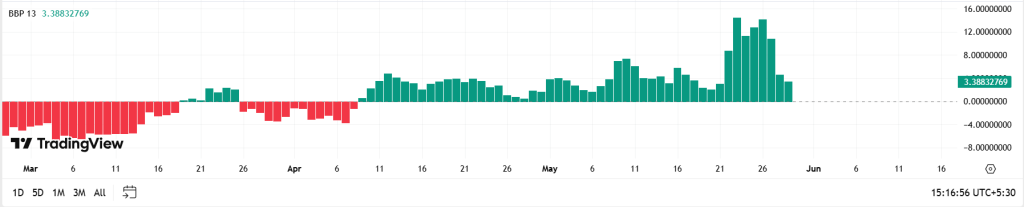
- BBP (Bulls Bears Power) : Reading at 3.038 down from 13.972 during ATH and declining, suggesting waning buy pressure.
Momentum remains positive but shows signs of exhaustion. A decisive break below $30.41 would mark a short-term sentiment shift.
HYPE TVL Hits 2-Month High, Reinforcing Fundamentals
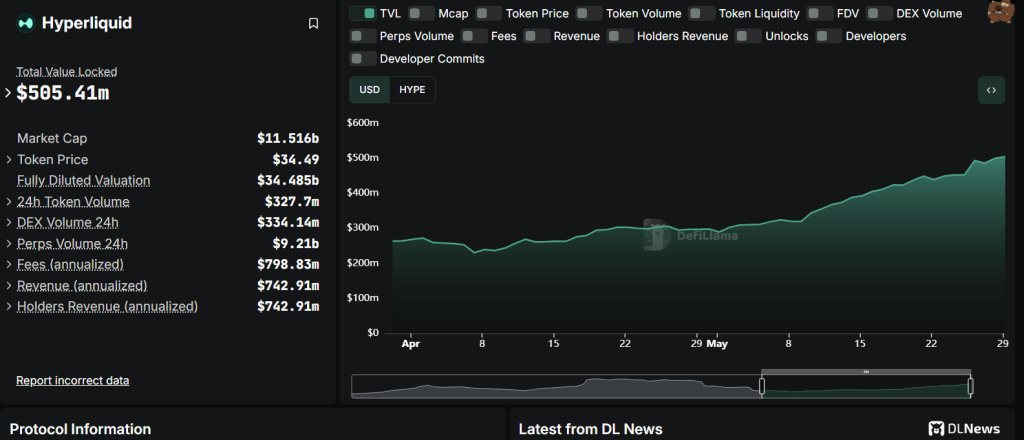
DeFiLlama data shows TVL rising from $268.9M (April 1) to over $500M by May 29. This increase suggests continued long-term investor confidence.
Protocol Strength: Revenue & Fee Dominance Back the Rally
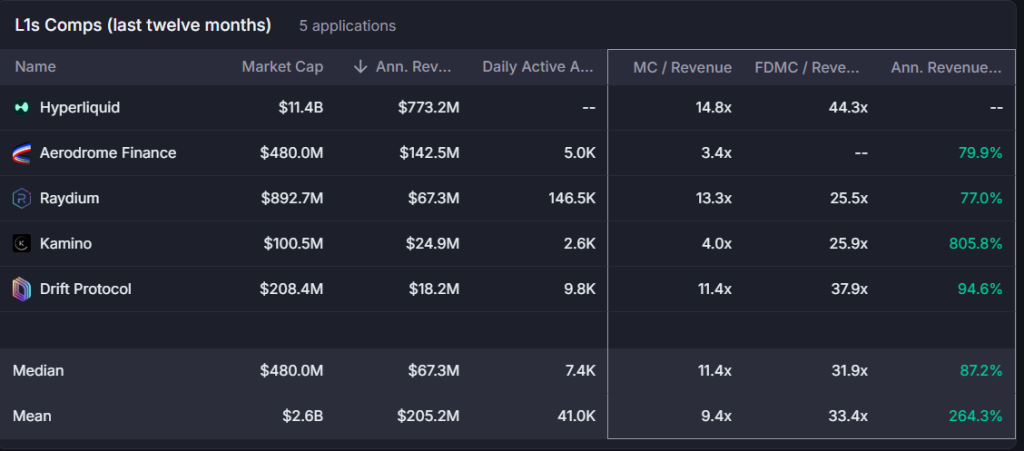
Over the past 12 months, Hyperliquid generated $773.2M in revenue with a market cap of $11.4B — outperforming peers like Raydium and Aerodrome. Despite a 14.8x MC/Revenue ratio, its growth justifies the premium.
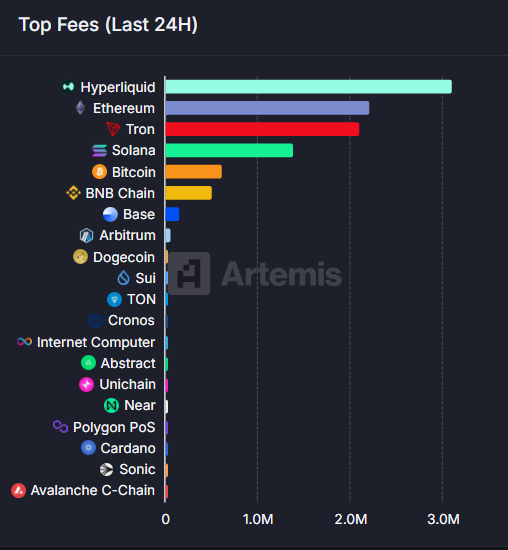
In the last 24 hours, Hyperliquid led all blockchains in fee generation, with $3.1M in protocol fees, according to Artemis.
These metrics highlight strong usage and a sustainable growth model.
HYPE Price Levels to Watch
Support levels: $33.00 (Tenkan-sen), $30.41 (20 EMA), $27.38 (100 EMA). Resistance levels: $35.50 (minor ceiling), $39.93 (ATH), $42.00 (target).
HYPE Price Prediction: Can Bulls Reclaim $39.93?
Hyperliquid remains in a strong uptrend despite recent cooling, supported by high open interest and robust trading activity. The recent pullback appears healthy within the broader parabolic structure.
Short-Term Forecast (May 29 – June 5):
- Possible short-term pullbacks to $30.41–$31.30.
- Holding above $30 would preserve the current bullish arc.
- A breakout above $35.50 could send HYPE toward $39.93.
Mid-Term Outlook (June 5 – June 14):
- If $39.93 breaks with volume, the next resistance lies at $42.00.
- Continued strength above $42 may target $46–$48.
- The bullish structure remains valid as long as $30 holds. Failure below this could lead to a deeper correction toward $27.38.
Traders should monitor volume confirmation, RSI trends, and MACD signals to validate directional momentum.

Can Pakistan’s Bitcoin Mining Move Impact BTC Price? Experts Doubt It
The post Can Pakistan’s Bitcoin Mining Move Impact BTC Price? Experts Doubt It appeared first on Coi...

Crypto Billionaire Justin Sun Set for Space Flight? Blue Origin’s Tweet Sparks Buzz
The post Crypto Billionaire Justin Sun Set for Space Flight? Blue Origin’s Tweet Sparks Buzz appeare...

IRS vs. Coinbase: Supreme Court Asked to Reject Crypto Privacy Challenge
The post IRS vs. Coinbase: Supreme Court Asked to Reject Crypto Privacy Challenge appeared first on ...