Bitcoin Price Faces Key Hurdles — Can Bulls Power Through?


Bitcoin price started a fresh increase above the $108,000 zone. BTC is now consolidating and might start another increase if it clears $110,750
- Bitcoin started a fresh upward move above the $107,500 zone.
- The price is trading above $108,500 and the 100 hourly Simple moving average.
- There is a connecting bullish trend line forming with support at $109,200 on the hourly chart of the BTC/USD pair (data feed from Kraken).
- The pair could gain bullish momentum if it clears the $110,750 resistance.
Bitcoin Price Consolidates Gains
Bitcoin price found support near the $106,650 zone and recently started an upside correction . BTC traded above the $107,500 and $108,000 resistance levels.
There was a move above the 50% Fib retracement level of the recent decline from the $111,982 swing high to the $106,672 low. The price even spiked above the $110,000 resistance zone. However, the bears were active near the $110,200 level.
The price failed to settle above the 61.8% Fib retracement level of the recent decline from the $111,982 swing high to the $106,672 low. Bitcoin is now trading above $108,500 and the 100 hourly Simple moving average . There is also a connecting bullish trend line forming with support at $109,200 on the hourly chart of the BTC/USD pair.
On the upside, immediate resistance is near the $110,000 level. The first key resistance is near the $110,750 level. The next key resistance could be $111,800. A close above the $111,800 resistance might send the price further higher. In the stated case, the price could rise and test the $113,000 resistance level. Any more gains might send the price toward the $115,000 level.
Another Decline In BTC?
If Bitcoin fails to rise above the $110,000 resistance zone, it could start another correction. Immediate support on the downside is near the $109,200 level. The first major support is near the $108,500 level.
The next support is now near the $107,500 zone. Any more losses might send the price toward the $106,200 support in the near term. The main support sits at $105,000, below which BTC might gain bearish momentum.
Technical indicators:
Hourly MACD – The MACD is now losing pace in the bullish zone.
Hourly RSI (Relative Strength Index) – The RSI for BTC/USD is now above the 50 level.
Major Support Levels – $108,500, followed by $107,500.
Major Resistance Levels – $110,000 and $110,750.
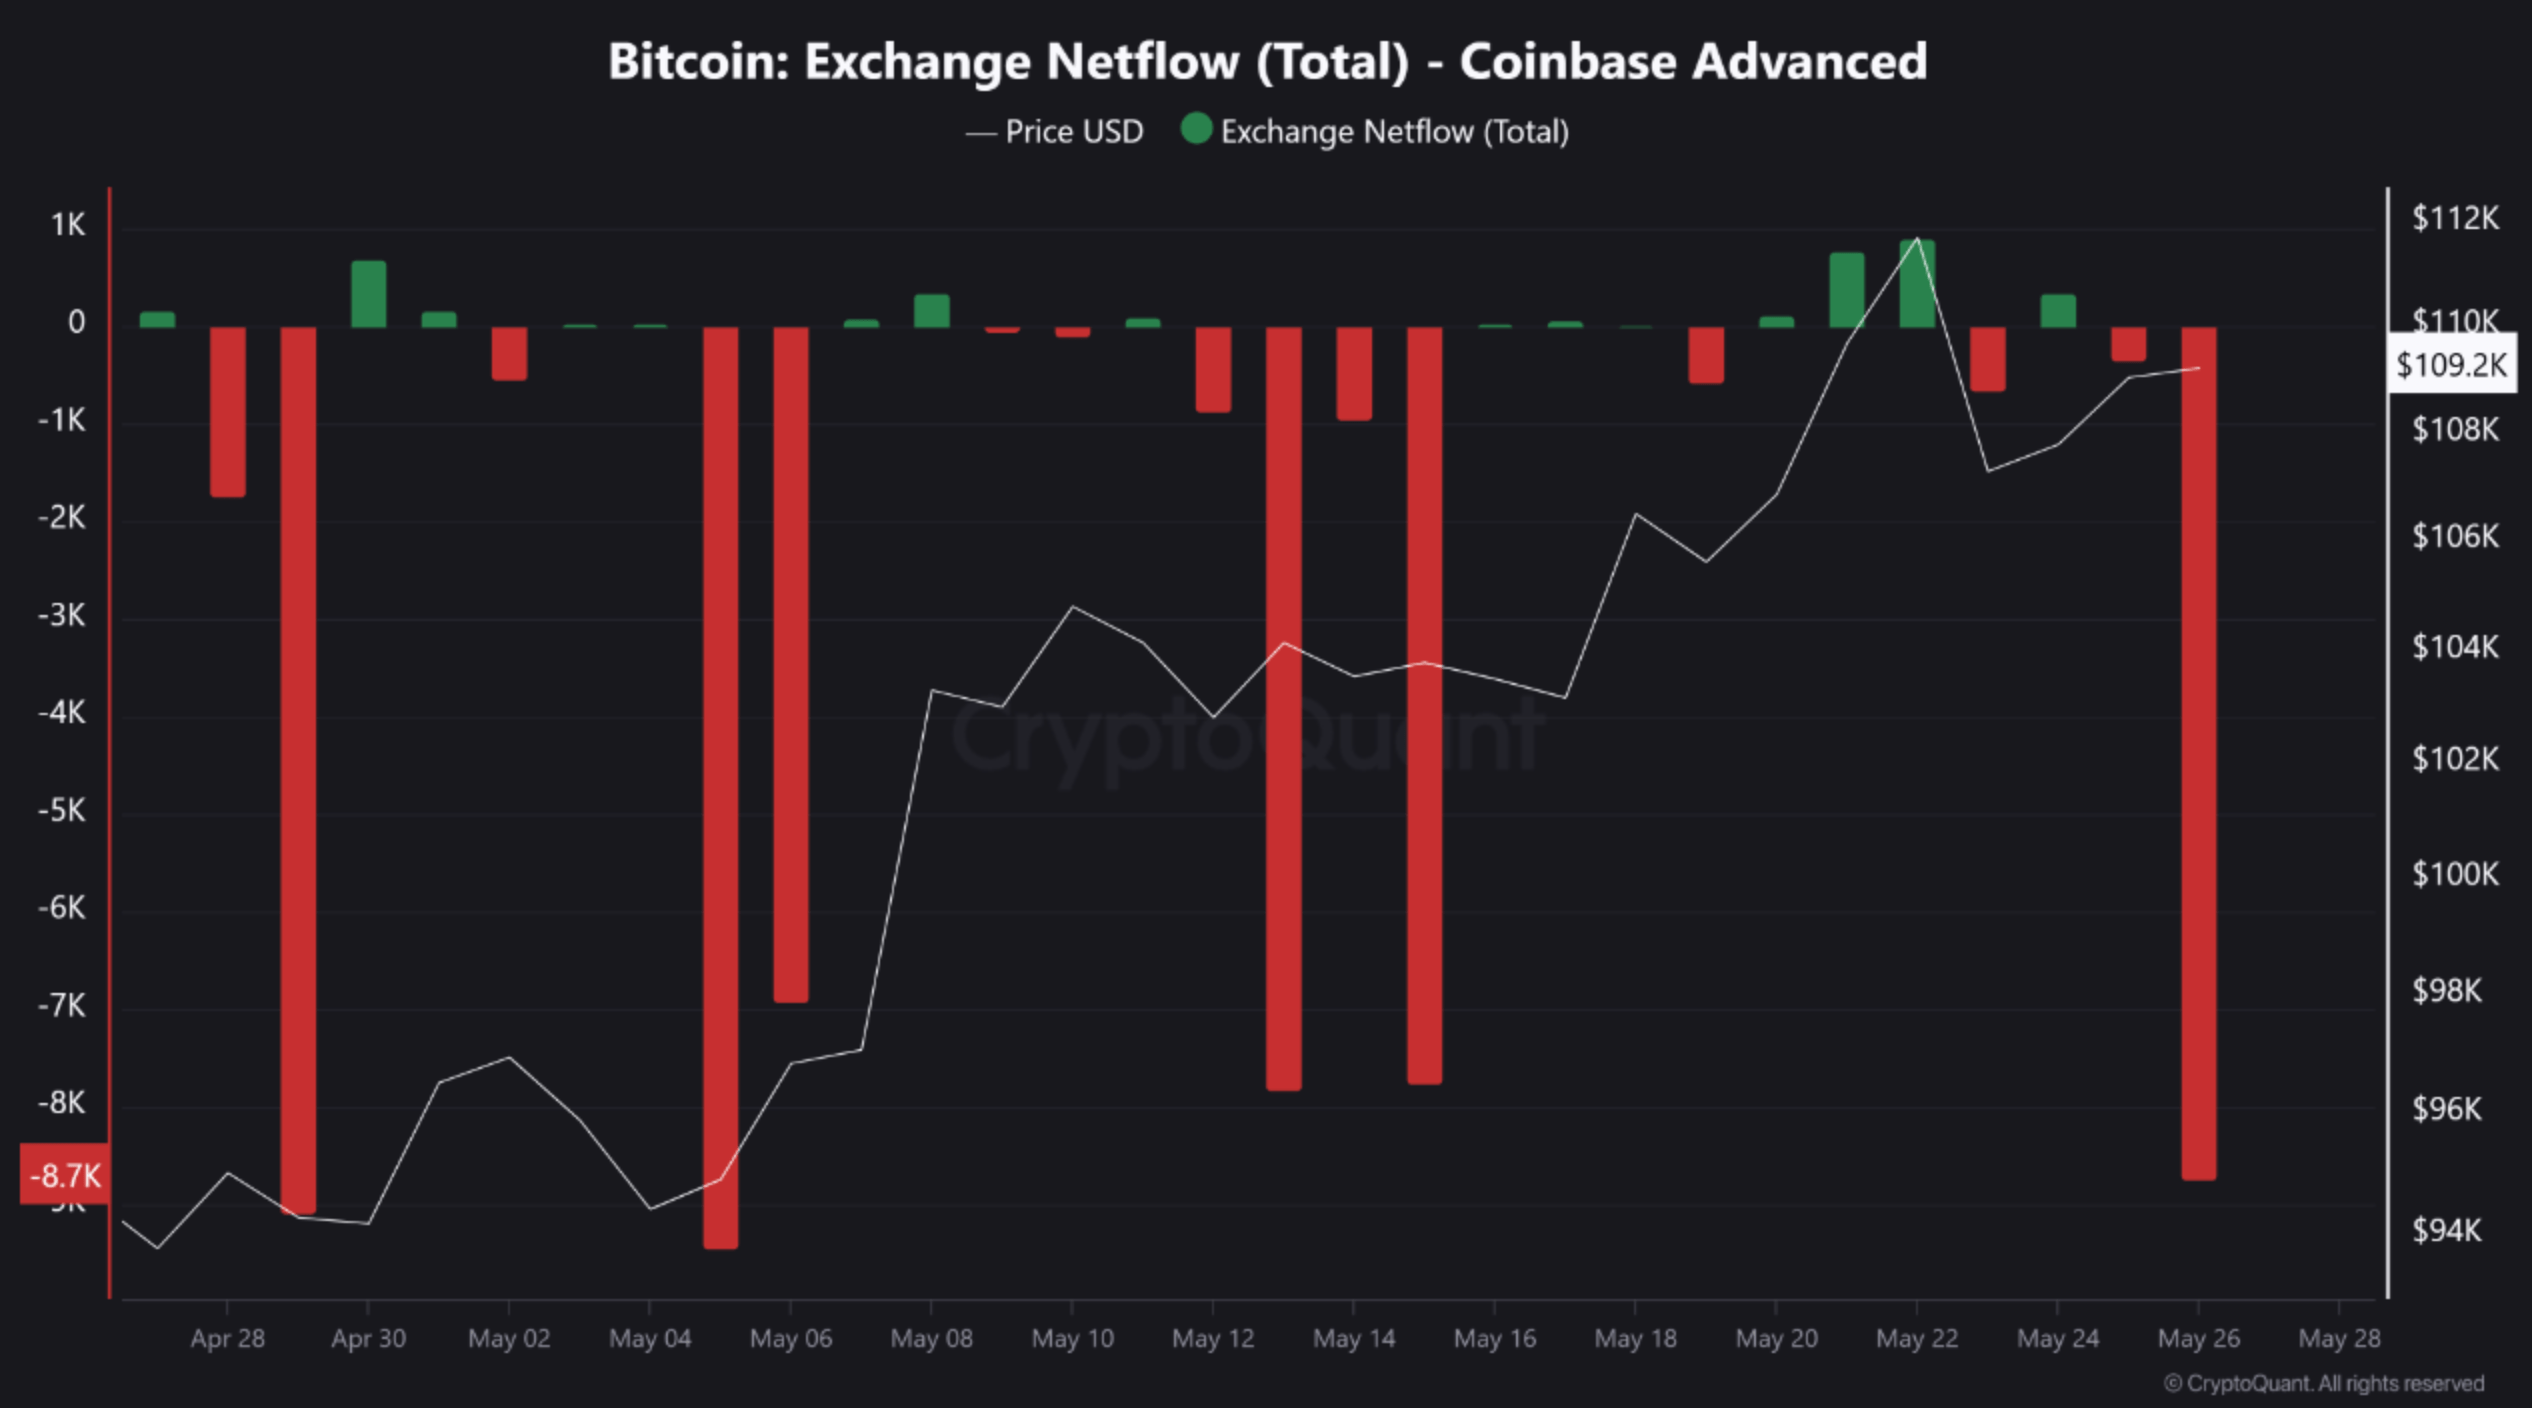
Bitcoin Sees Massive 7,883 BTC Outflow From Coinbase – Are Institutions Loading Up?
As Bitcoin (BTC) continues to trade near its recent all-time high (ATH) of $111,980, activity on maj...
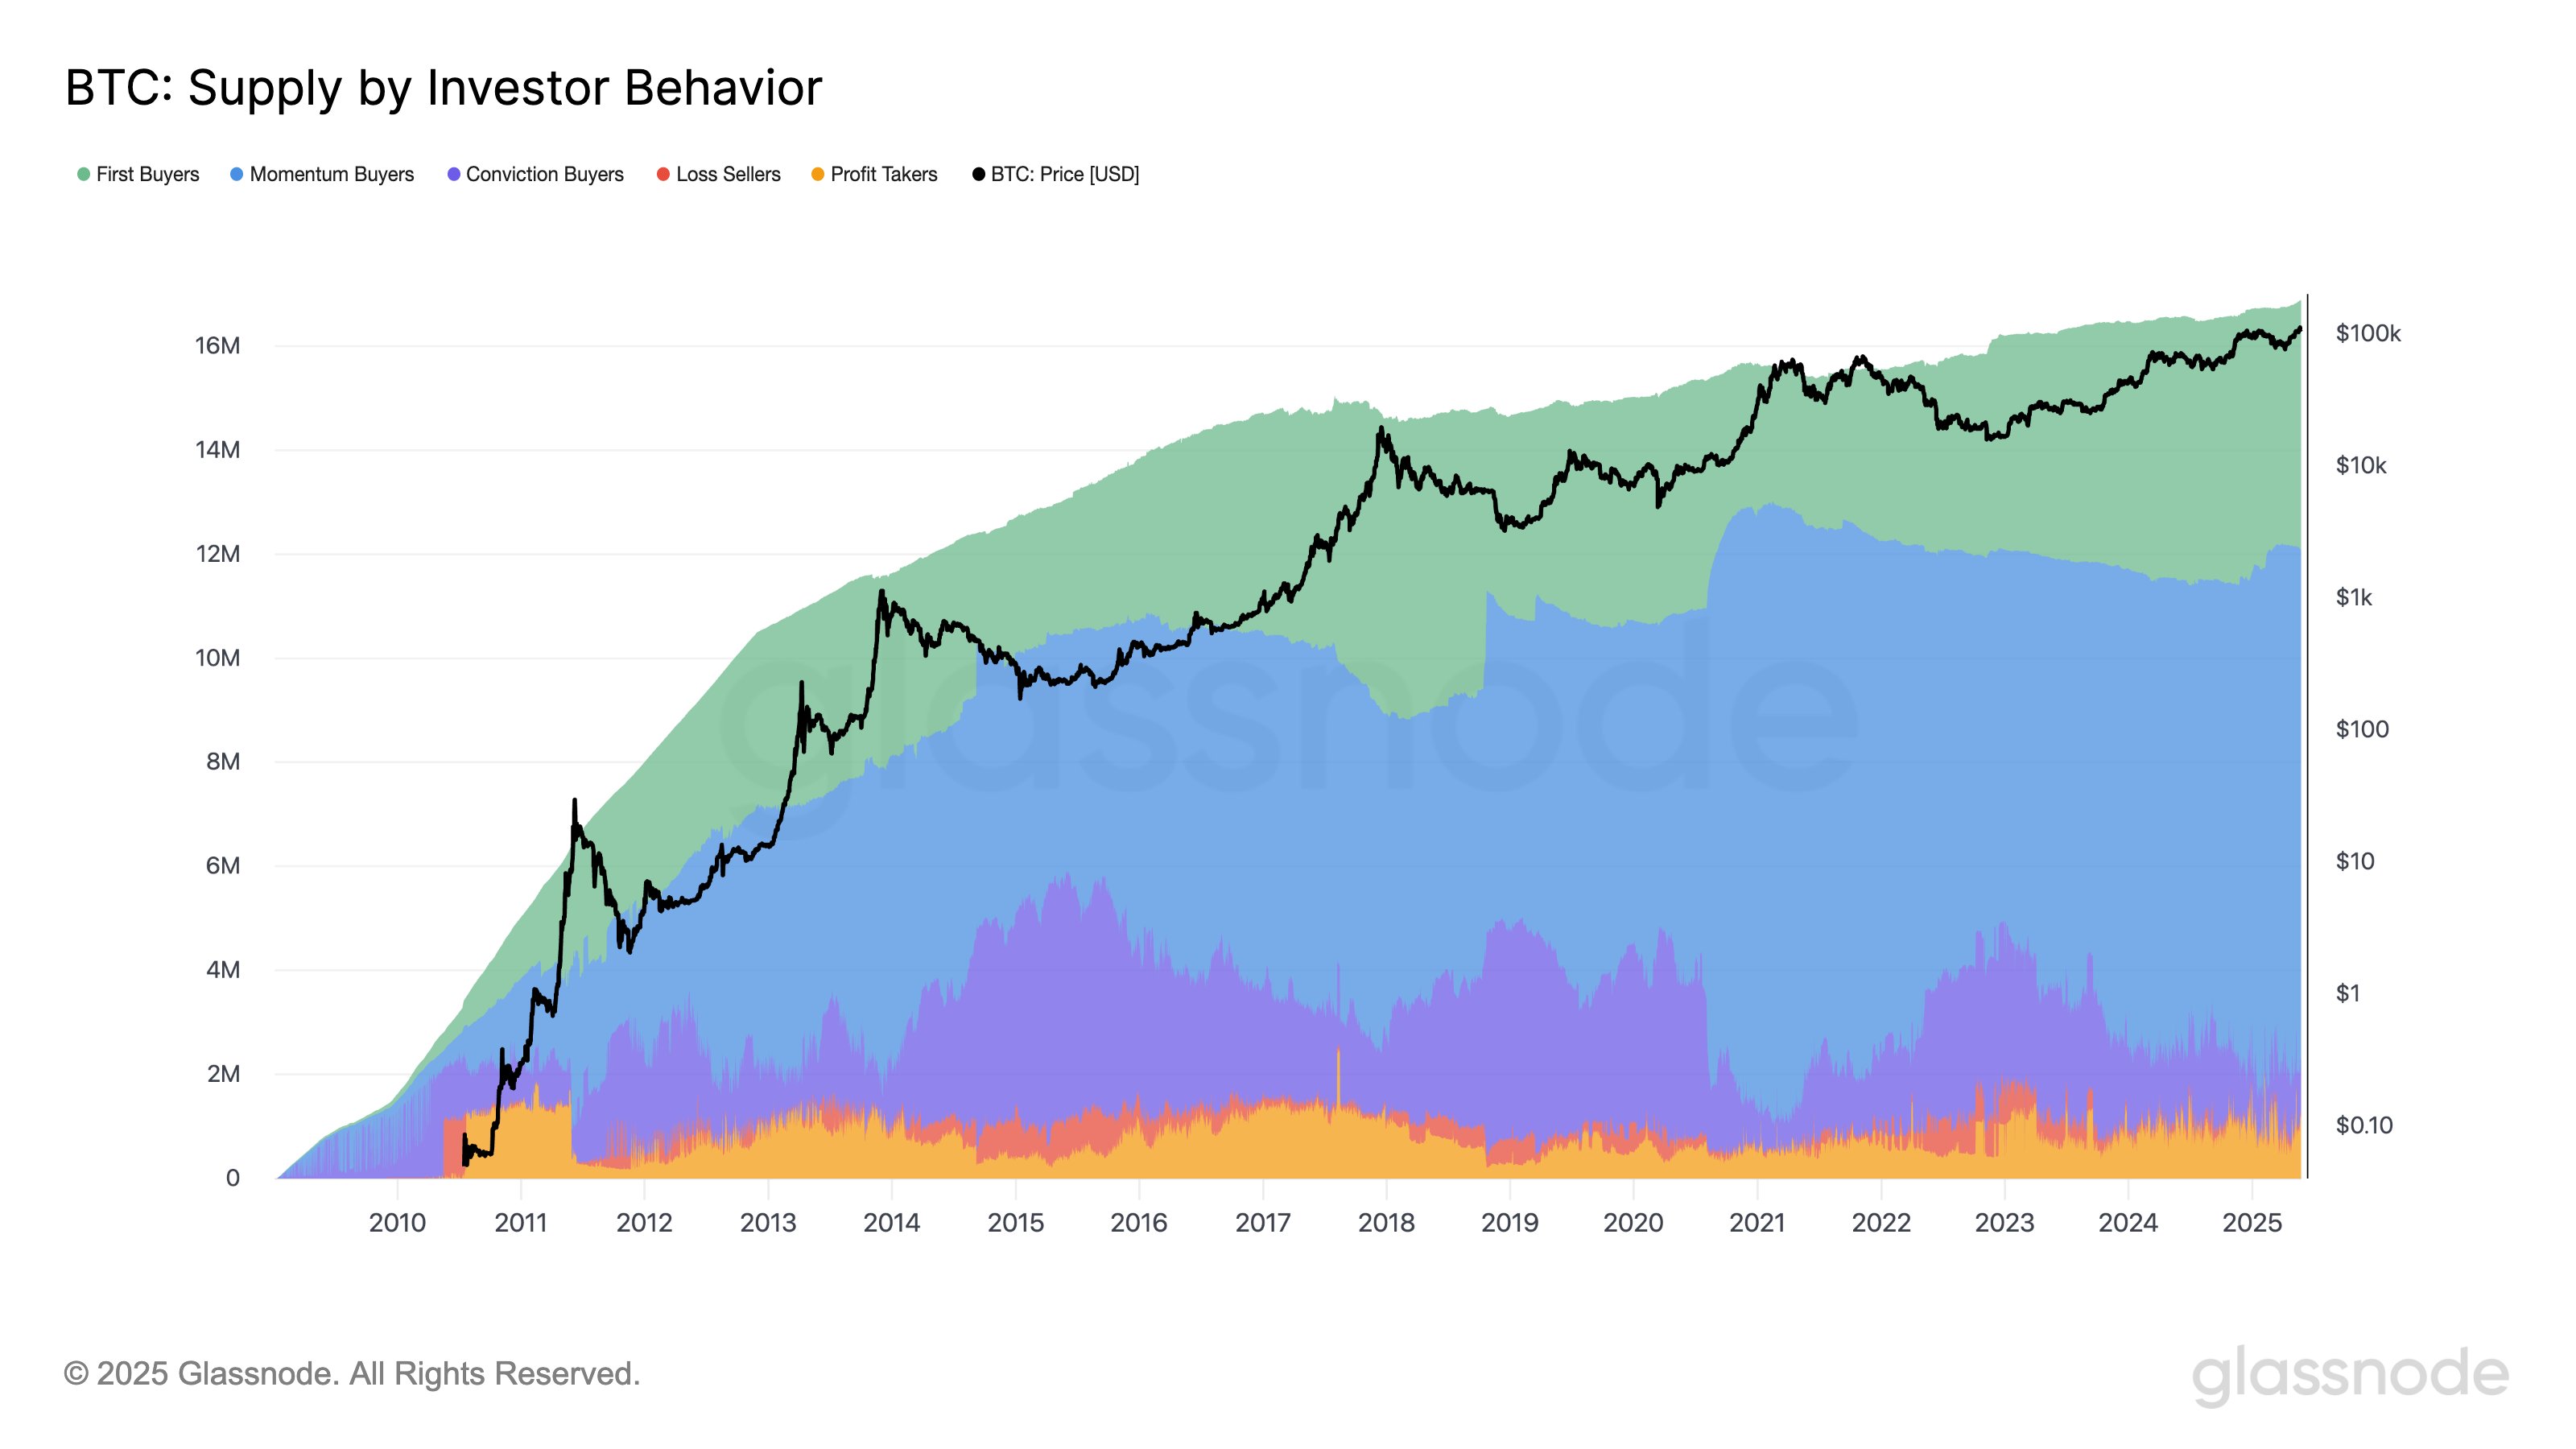
How Does Bitcoin Investor Behavior Shape Trends? Glassnode Reveals
The on-chain analytics firm Glassnode has explained how Bitcoin investor behavior tends to reflect i...
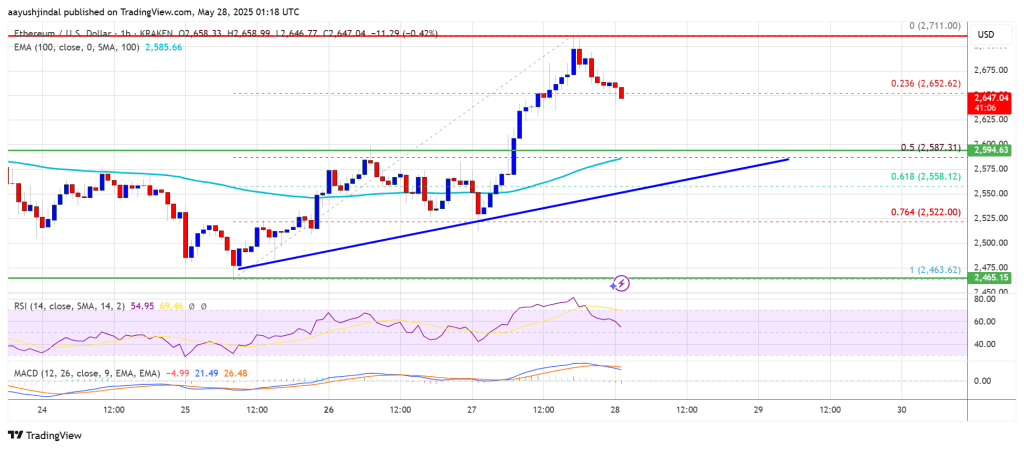
Ethereum Price Rallies as Bitcoin Takes a Breather — Is ETH Leading the Charge?
Ethereum price found support at $2,460 and started a fresh increase. ETH is now up over 5% and might...