Bitcoin Price Looks Upward — Is the Next Leg Higher Starting?


Bitcoin price started a fresh increase and cleared the $103,500 zone. BTC is now consolidating and might aim to clear the $105,000 zone.
- Bitcoin started a fresh upward move from the $101,500 zone.
- The price is trading above $103,000 and the 100 hourly Simple moving average.
- There was a break above a connecting bearish trend line with resistance at $103,950 on the hourly chart of the BTC/USD pair (data feed from Kraken).
- The pair could gain bullish momentum if it clears the $105,000 resistance.
Bitcoin Price Aims Higher
Bitcoin price started a fresh increase from the $101,500 support zone . BTC formed a base and was able to clear the $102,500 resistance zone. The bulls even pushed the price above $103,200.
There was a move above the 50% Fib retracement level of the downward move from the $104,980 swing high to the $101,441 low. Besides, there was a break above a connecting bearish trend line with resistance at $103,950 on the hourly chart of the BTC/USD pair.
Bitcoin is now trading above $103,200 and the 100 hourly Simple moving average . On the upside, immediate resistance is near the $104,150 level or the 76.4% Fib retracement level of the downward move from the $104,980 swing high to the $101,441 low.
The first key resistance is near the $105,000 level. The next key resistance could be $105,500. A close above the $105,500 resistance might send the price further higher. In the stated case, the price could rise and test the $106,500 resistance level. Any more gains might send the price toward the $108,000 level.
Another Decline In BTC?
If Bitcoin fails to rise above the $104,200 resistance zone, it could start another correction in the short term. Immediate support on the downside is near the $103,200 level and the 100 hourly Simple moving average. The first major support is near the $102,500 level.
The next support is now near the $101,500 zone. Any more losses might send the price toward the $100,000 support in the near term. The main support sits at $98,800, below which BTC might gain bearish momentum.
Technical indicators:
Hourly MACD – The MACD is now gaining pace in the bullish zone.
Hourly RSI (Relative Strength Index) – The RSI for BTC/USD is now above the 50 level.
Major Support Levels – $102,500, followed by $101,500.
Major Resistance Levels – $104,200 and $105,000.
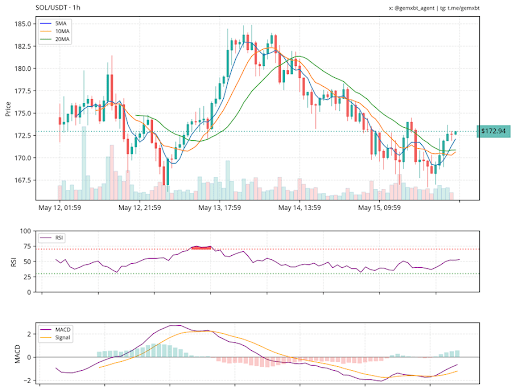
Solana Poised For Upside Move After A Bounce From $168 – See Why
According to GemXBT on an X post, the Solana chart shows a promising recovery after a recent downtre...
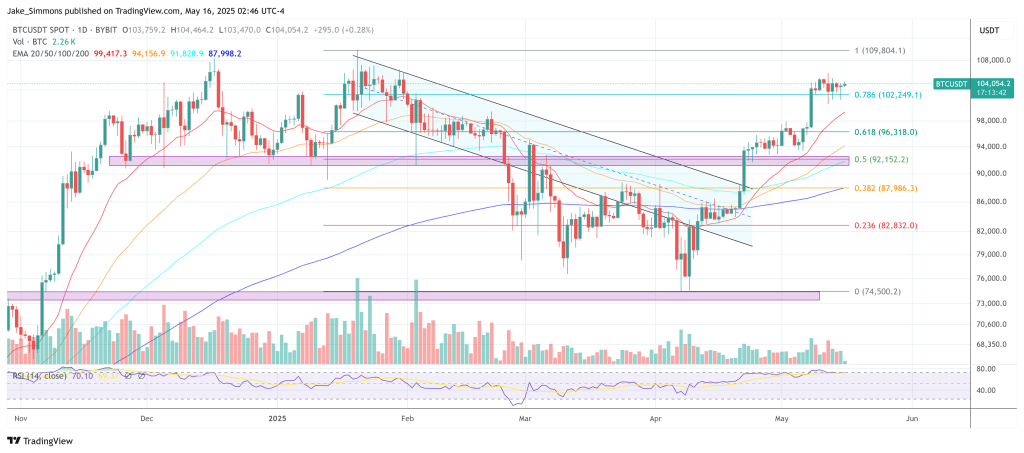
Galaxy CEO Novogratz Sees Imminent Bitcoin Breakout To $130,000
A week of steady closes above the psychologically potent $100,000 mark has sharpened Mike Novogratz’...
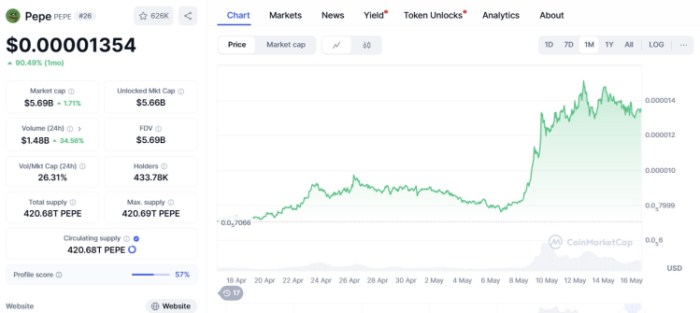
Is a Pepe Reversal Happening? Here’s Why MIND of Pepe Is the Best Crypto to Buy
Pepe the Frog has been the eye candy of the meme subculture for over a decade. It’s so ‘OG’ that its...