Bitcoin Price Flashes Signal That Has Led To A Surge Every Time


The Bitcoin price action has once again caught the attention of the broader crypto market, as it flashes major bullish signals that have, without fail, led to significant rallies throughout this cycle. Building on this technical signal, a crypto analyst has forecasted that Bitcoin could mirror historical trends and potentially surge to a new all-time high .
Bollinger Band Signal Hints At Bitcoin Price Rally
A closer look at Bitcoin’s weekly chart presented by Bitcoinsensus on X (formerly Twitter) reveals a critical pattern that has only appeared four times since 2022. Each occurrence has marked the beginning of a strong upward movement in Bitcoin’s price , making this a highly bullish setup.
The signal in question is the Bollinger Bands , which is known to identify potential reversal zones. The analysis shows that Bitcoin has recently touched the lower Bollinger Band on the weekly chart and bounced upward, confirming a support level that historically acted as a springboard to sustained bullish momentum .
This marks the fifth time this specific signal has occurred during this cycle. Each of the past four signals, highlighted by the white circles on the chart, was followed by strong price rallies.
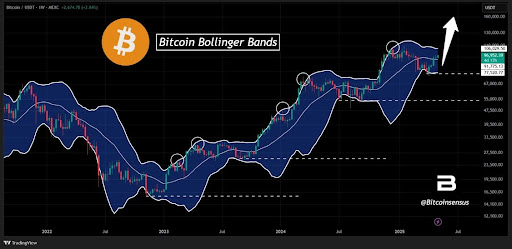
Notably, in early 2023, Bitcoin rallied from below $2,000 to over $30,000 following the appearance of this Bollinger Band signal. A similar pattern played out in mid-2023 when this setup triggered a surge that pushed Bitcoin above $45,000. Later that year, the same signal preceded a breakout, with BTC soaring past $60,000. Most recently, in early 2024, the Bollinger Band signal sparked a parabolic run above $100,000.
Now, in Q2 of 2025, Bitcoin is once again flashing this historically reliable indicator . Its price found strong support near the $77,500 level, with resistance levels set above $106,000. As the Bollinger Bands align, Bitcoinsensus predicts a potential rally toward $130,000 – $160,000. This would mark a historical all-time high for Bitcoin, representing a maximum increase of over 46.7% from its current ATH above $109,000 .
BTC Poised For Breakout As Price Nears $100,000 Again
The Bitcoin price is once again approaching the $100,000 mark after its latest 4.75% surge this past week. Amidst its price recovery, crypto analyst Trader Tardigrade predicts that Bitcoin will soon break out of bearish resistance to reach new highs.
The analyst shared a BTC chart analysis highlighting a recurring breakout pattern that has historically preceded large upward moves after a breakout from a descending resistance trendline . This pattern has emerged three times in the past: first from late 2022 to early 2023, then from mid-2023 to early 2024, and finally from late 2024 to early 2025.
In the current setup, Bitcoin is once again testing the descending trendline resistance and appears to be breaking out from it. If history is any indication, the analyst projects a potential target zone between $100,000 – $136,000, marking a new ATH.

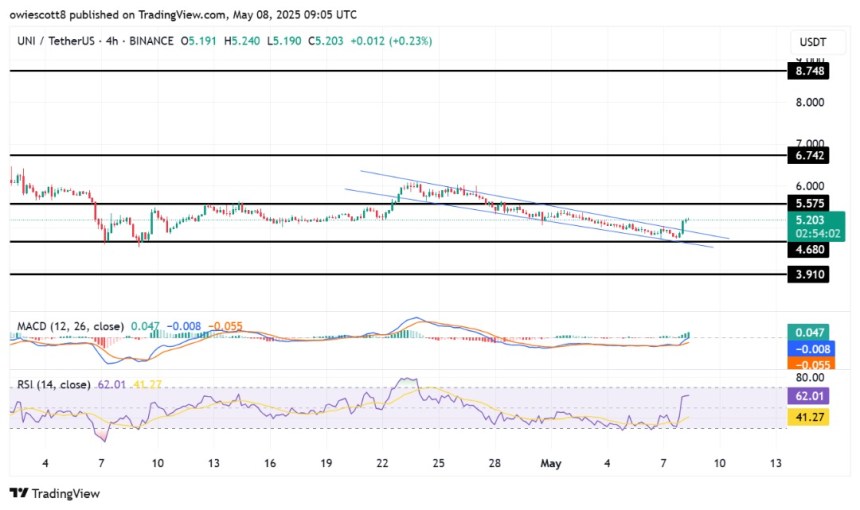
Uniswap (UNI) Blastoff At Hand? The Sleeping Giant Awakens At $4.6 Support
Uniswap (UNI) is showing signs of a powerful resurgence as it firmly holds the $4.60 support level, ...
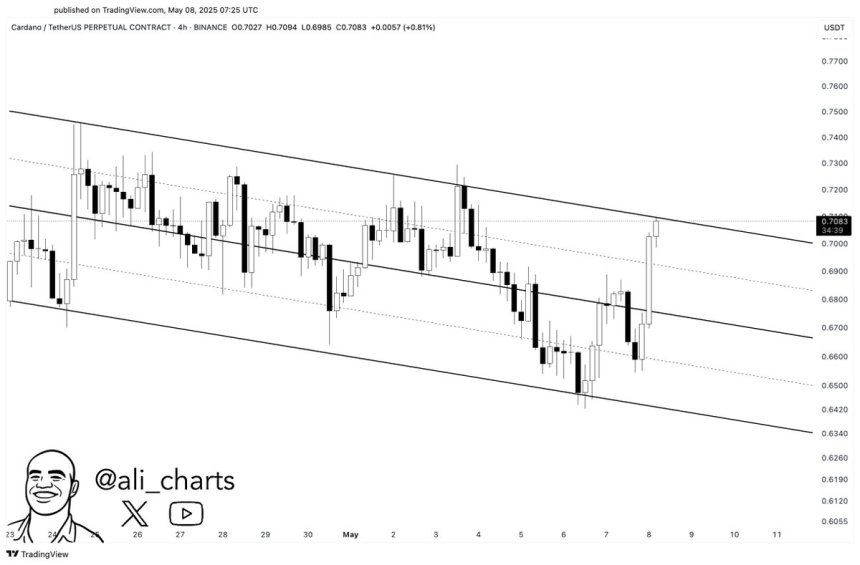
Cardano Approaches Critical Resistance – Break Above Could Trigger Move To $0.80
Cardano is gaining bullish traction, pushing above the $0.70 mark as it attempts to reclaim the $0.7...
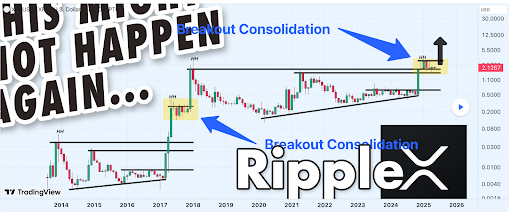
XRP Price Repeating History? 2017-Like Rally To Send Price To $10
Crypto analyst ArShevelev has raised the possibility of history repeating itself for the XRP price. ...