




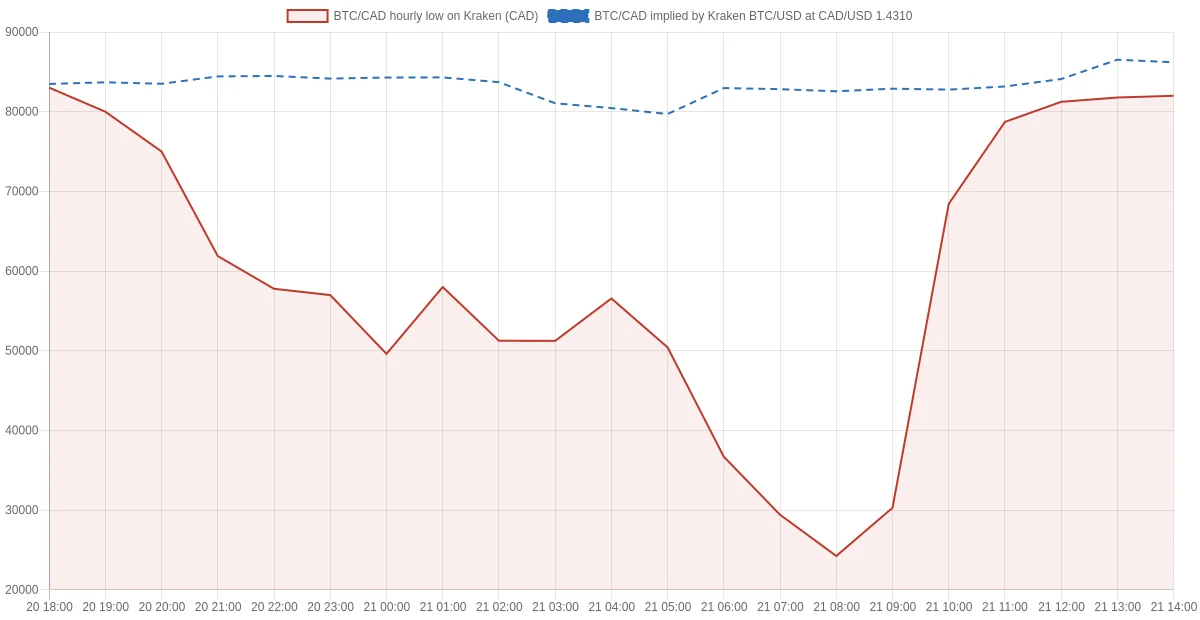
At 08:00 UTC on 21 November, one bitcoin cleared on Kraken for C$24,250. In the same hour, the exchange’s own bitcoin-dollar pair closed at $57,693.10. Converted at the CAD/USD rate Kraken was quoting twelve hours earlier, 1.4310, that Canadian print was worth $16,946.
The gap was not confined to bitcoin or to a single tick. In that same 08:00 hour, the lowest print on Kraken’s BTC/CAD, ETH/CAD, SOL/CAD and XRP/CAD books all landed between 65.8% and 70.6% below the level implied by the venue’s own dollar prices. Kraken’s support account described the episode in a post published on 21 November : “Starting around 20:00 UTC on Nov 20, CAD pairs on Kraken saw heavy selling pressure that pushed prices well below other markets.” The same post settles the question sellers cared about most: “Executed trades stand.”
Starting around 20:00 UTC on Nov 20, CAD pairs on Kraken saw heavy selling pressure that pushed prices well below other markets. Our platform processed every order correctly, and our security teams found no sign of a breach or compromised accounts. Executed trades stand.
— Kraken Support (@krakensupport) November 21, 2026
That sentence is the story. A Canadian seller who hit the bid at the wrong hour took a haircut of roughly 70% against the dollar market. A buyer who rested at C$24,250 owned an asset that Kraken’s own CAD book marked at C$79,315 two hours later. Both sides keep their fills, which makes this an unusually clean example of what a thin fiat book costs the people who have to trade through it, and of what an exchange’s data can reveal that its statement does not.
The Hour Every Kraken CAD Pair Bottomed Together
Kraken publishes hourly open, high, low, close and volume for every pair it lists, through the same OHLC endpoint its API customers use. Pulling XBT/CAD and XBT/USD for 20 and 21 November produces a sequence that is hard to read as four separate accidents.
| Pair | Low print, 08:00 UTC (CAD) | USD close, same hour | Same coins at CAD/USD 1.4310 | Discount | 21 Nov CAD volume vs 19 Nov |
|---|---|---|---|---|---|
| BTC/CAD | 24,250.00 | $57,693.10 | C$82,559 | 70.6% | 521.79 BTC vs 23.93 (21.8x) |
| ETH/CAD | 796.27 | $1,625.29 | C$2,325.81 | 65.8% | 1,147.39 ETH vs 464.58 (2.5x) |
| SOL/CAD | 32.00 | $67.19 | C$96.15 | 66.7% | 11,860.07 SOL vs 1,376.94 (8.6x) |
| XRP/CAD | 0.41300 | $0.88481 | C$1.266 | 67.4% | 1,293,801 XRP vs 212,922 (6.1x) |
Four different assets, four different liquidity profiles, one shared timestamp. The dollar books were having an ordinary, violent weekend: bitcoin fell to $55,100 on Kraken on 21 November during the same global selloff that took ether to $1,536 and solana to $64.79. What happened in Canadian dollars was not an ordinary selloff. It was a repricing of everything the CAD book touched, concentrated in the hours after 20:00 UTC on 20 November and unwound by mid-morning on 21 November.
What Kraken Said, and What It Did Not Say
The support post is short and answers three questions directly. On cause: “CAD pairs on Kraken saw heavy selling pressure that pushed prices well below other markets.” On integrity: “Our platform processed every order correctly, and our security teams found no sign of a breach or compromised accounts.” On the outcome for affected traders: “Executed trades stand.”
It does not explain why a book that clears 20 bitcoin on a normal day absorbed roughly 250 bitcoin on 20 November and another 522 on 21 November without a wider bid appearing, why the dislocation spread across every CAD pair at once, or whether any participant was compensated. Kraken’s public status page carried no incident entry for the CAD pairs when checked on 22 November. The support post is the only substantive public account of the event.
Read plainly, the explanation is order flow meeting insufficient depth. That is a defensible description of what a seller experiences. It is not a complete description of what the data shows.
The USD/CAD Print That Does Not Fit a Selloff
Kraken also quotes USD/CAD, a pair with no crypto leg at all. At 18:00 UTC on 20 November it closed at 1.43101. By 07:00 UTC on 21 November it printed a low of 0.55518, a 61% move in the price of a US dollar expressed in Canadian dollars, and it was back at 1.372 by 10:00.
The arithmetic across pairs is consistent to within 0.6% in the 08:00 hour: 45,000 divided by 57,693.10 gives 0.78000, against the USD/CAD close of 0.77553. In other words, the CAD book did not print one bad bitcoin tick. It repriced the Canadian dollar itself against everything else quoted on the venue, and every CAD pair inherited the shift.
That matters analytically, because selling crypto for Canadian dollars should push USD/CAD up, not down: more CAD in circulation per dollar, weaker CAD. On Kraken the opposite happened, and the move was present in the cross before it was visible in bitcoin. The data does not establish the mechanism, and Kraken has not described one beyond selling pressure. What can be said is narrower and still important: the failure was in the Canadian dollar leg of the venue, not in the assets being sold, and the exchange’s statement addresses the asset prices while leaving the currency leg unexplained.
592 Bitcoin, a C$51,886 Average, and a C$18.3 Million Gap
From 20:00 UTC on 20 November to 10:00 UTC on 21 November, Kraken’s XBT/CAD book cleared 592.24 bitcoin across 22,850 trades. The volume-weighted average price was C$51,886, and total CAD notional was C$30.73 million.
Those same coins, priced at Kraken’s own BTC/USD close in each of those hours and converted at 1.4310, were worth C$48.99 million. The difference is C$18.26 million, or about $12.77 million at the pre-event rate, transferred from sellers who needed Canadian dollars in that window to whoever was bidding beneath them. This is not an estimate of exchange losses: Kraken’s statement suggests the venue bore no loss itself. It is the size of the price gap that real orders crossed.
The distribution of that gap was extremely uneven. A seller who filled at the 08:00 low at C$24,250 left C$58,300 on the table per coin against the venue’s own dollar price. A buyer at that level was up 227% two hours later, when the CAD book closed at C$79,315.
Why a Half-Percent Book Can Print Seventy-Percent Discounts
The Canadian dollar book is small even by Kraken’s own standards. On 19 November, XBT/CAD cleared 23.93 bitcoin against 4,413.98 on XBT/USD, about 0.5% of the venue’s bitcoin volume. On 20 November the CAD book rose to 2.8% of the dollar book as the selloff began, and on 21 November it traded 21.8 times its 19 November volume.
A book of that size does not need a large seller to move 70%. It needs a seller who is indifferent to price, or one who has to sell, plus a bid side that has stepped away. The CAD crypto pairs on Kraken number twelve, including EUR/CAD, USDC/CAD, USDT/CAD and a handful of token pairs; the depth behind a C$24,250 bid in bitcoin is a fraction of what sits behind the same level in dollars. When the market’s ordinary liquidity providers widen or leave during a global selloff, the remaining bids are whatever resting orders happen to exist.
There is a second reason the CAD book is fragile in exactly this way. Kraken’s Canadian dollar prices are not set independently of its dollar prices: the venue’s own USD/CAD quote is the bridge between the two. When that cross moved 61% and back within three hours, the CAD pairs had no anchor left. Each of the four CAD crypto pairs examined here followed the cross down and then followed it back up.
What a Canadian Seller Should Take From It
The practical lesson is about which book you use, not which coin you hold. A seller who needs Canadian dollars is trading in the thinnest part of the venue, in the hours when everyone else is selling, and the fill is final. Kraken’s parent Payward reported $487 million of total platform margin in the third quarter, and the Q3 figures describe a business built on a much larger dollar book than the Canadian one.
Three habits follow from the data. Check the depth of the exact pair before sending a market order, because a C$24,250 print is what an empty book looks like. Consider quoting in USD or USDT and converting the proceeds separately, since the FX leg is where the dislocation started. And expect the venue to stand behind the fill: “Executed trades stand” is a clear policy, and it cuts both ways.
The broader point belongs to market structure rather than to Kraken specifically. Crypto venues advertise 24/7 access and no halts, and the trade-off is that a thin quote currency can gap 70% with no mechanism to slow it. Equity markets publish limit-up and limit-down bands because without them, one market order in a thin book becomes everyone’s price. Spot crypto venues do not publish price bands of that kind, so the burden falls on the trader who sends the order and on the exchange that decides afterwards whether the fill was real. Kraken decided it was, and said so in a single sentence. The plumbing that moves dollars and stablecoins around these venues is better documented than the depth that stands behind them, and the weekend’s CAD prints are what that gap looks like when it gets tested.
Frequently Asked Questions
Kraken’s public statement says the platform processed every order correctly and that executed trades stand. It did not announce cancellations, reversals or compensation for the Canadian dollar pairs.
Kraken said its security teams found no sign of a breach or compromised accounts. The exchange attributed the move to heavy selling pressure in CAD pairs, and the venue’s own data shows every CAD pair repricing in the same 08:00 UTC hour on 21 November.
Kraken’s XBT/CAD series shows a low of C$24,250 in the 08:00 UTC hour on 21 November, 70.6% below the CAD level implied by the venue’s own BTC/USD close converted at the 1.4310 rate quoted before the dislocation.
Yes. ETH/CAD, SOL/CAD and XRP/CAD all bottomed in the same hour, between 65.8% and 70.6% below their USD-implied levels, while the USD pairs for the same assets traded in a normal range.
Whether Kraken publishes a post-mortem, whether CAD pair depth recovers to its pre-event level of roughly 20 to 25 bitcoin a day, and whether the USD/CAD cross on the venue stays anchored near its historical range instead of gapping during the next global selloff.
Data: Kraken XBT/CAD OHLC , Kraken XBT/USD, ETH/CAD, SOL/CAD, XRP/CAD and USD/CAD series, 17 to 22 November 2026. Prices in this article are venue prints, not global index prices.
This article is not intended as financial advice. Educational purposes only.
The post Kraken’s C$24,250 Bitcoin Print Stands. Every CAD Pair Broke With It appeared first on BlockchainReporter .