




The perpetual funding record for Bitcoin over the past month reads like a market that refused to clear. Between 20 October and 18 November the contract settled 90 times on Binance, and not once did a full day close with a net-negative rate. Bybit produced the same result across its 90 settlements. OKX produced one negative day out of thirty. Spot, over those same thirty sessions, fell 23.6%.
That combination is the part worth sitting with. A decline of that size normally forces leverage out of a market, and funding is the mechanism that does the forcing: perps trade below spot, longs pay shorts, and the weakest positions close. This time the transfer ran the other way for thirty straight days. The aggregate charge came to 0.584% of notional, or roughly $372 for every coin held at today’s price. Longs were not carried out of the market. They paid to stay in it.
Bitcoin changed hands at $63,650 at 07:24 UTC on 19 November, down 1.66% in 24 hours and 22.1% on CoinGecko’s rolling thirty-day measure. From the 20 October close to the 18 November close, the fall was 23.6%, and that is the window used for the funding figures below. The session low of $62,063 sat $57 above the 18 November low of $62,006, which was the weakest level traded since 13 July.
Sentiment has already reached the floor of its range. The Crypto Fear and Greed Index read 10 on 19 November, classified as Extreme Fear, after 11 the day before and 12 the day before that.
Ninety Settlements, No Negative Day
Funding is not a sentiment survey. It is a transfer between the two sides of a perpetual swap, charged every eight hours, and its sign tells you which side is paying to hold the position. Positive funding means the contract trades above spot and longs pay shorts. Negative funding means the reverse.
| Venue | Net-negative days, 20 Oct–18 Nov | Cumulative funding | Latest settlement (00:00 UTC, 19 Nov) |
|---|---|---|---|
| Binance BTCUSDT | 0 of 30 | +0.5841% | +0.0094% |
| Bybit BTCUSDT | 0 of 30 | +0.5327% | +0.0033% |
| OKX BTC-USDT-SWAP | 1 of 30 | +0.5496% | −0.0010% |
Daily totals combine the three eight-hour settlements. Source: exchange funding-rate endpoints, retrieved 19 November 2026. Table: BlockchainReporter.
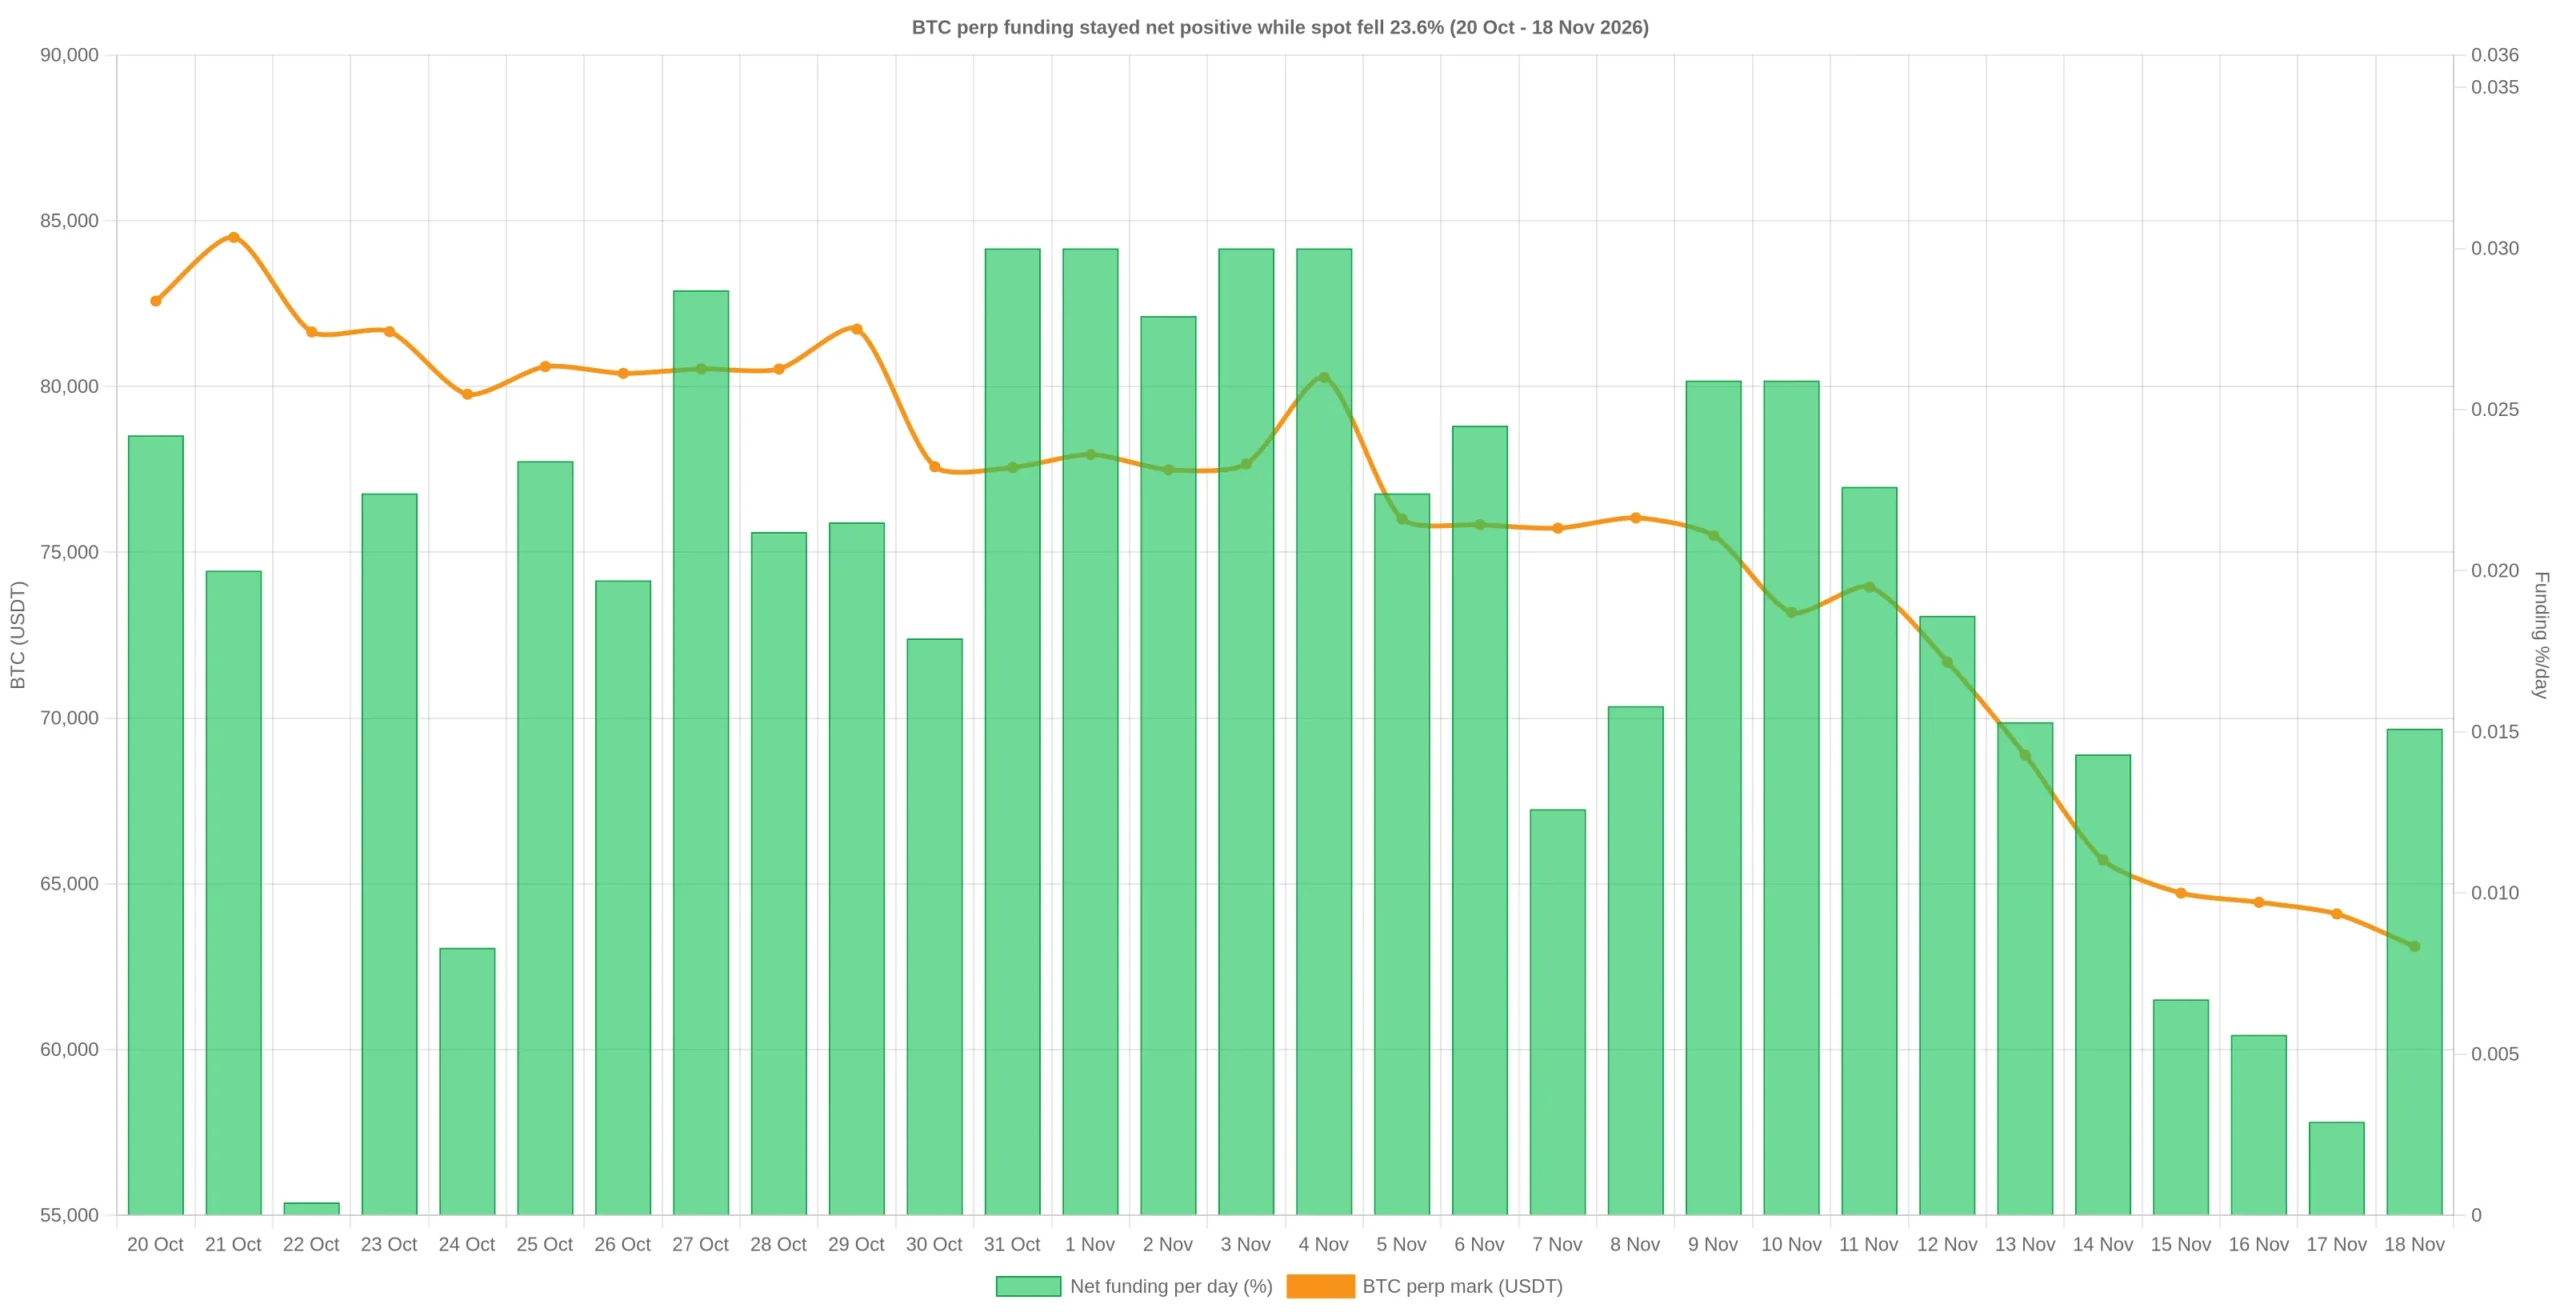
Two facts sit inside that table at the same time. Individual settlements did turn negative, and four of the nine prints between 15 and 17 November were below zero. A negative total for the day never materialised on Binance or Bybit, and it happened once on OKX. Across the 1,200 settlements recorded since October 2025, 270 were negative, or 22.5%. Only 76 of roughly 400 days closed net-negative, and just four have done so in the past 120 days.
So the rare event is not a negative print. It is a negative day, and the market has not delivered one since this leg of the sell-off began. The rebound to $65,000 on 15 November from a $61,899 low, when individual funding prints flipped negative , was the closest it came.
What the Carry Actually Cost
The average settlement over the thirty-day window was 0.0065%, which annualises to 7.1%. The latest print of 0.0094% annualises to 10.3%. For a leveraged long, that is the running cost of the position, charged three times a day whether the price rises or falls.
Set that against the move. Spot lost 23.6% while the funding bill came to 0.58% of notional. The carry was roughly one-fortieth of the drawdown. That ratio matters for how this eventually resolves: funding at 7% annualised is a drag, not a liquidation mechanism. What forces a long out of a position at this cost is the price, not the carry, which is another way of saying that the exit will be decided by the spot market rather than by a funding squeeze.
The same arithmetic explains why the positive sign survives a falling market. The funding leg pays roughly 7% to 10% annualised to whoever is short the perpetual and long the spot. A basis desk weighing that against its cost of financing does not need a directional view to hold the short side, and the resulting flow keeps funding positive even when the marginal directional buyer has disappeared. Positive funding, in other words, is no longer a clean read on bullish conviction. It is partly the price of carry in a market with a 3.75% to 4% policy rate.
Open Interest Lost a Quarter of Its Dollar Value Without Losing Positions
Binance’s BTCUSDT open interest tells a similar story. On 21 October it stood at 94,819 BTC, worth $7.869 billion. By 19 November it was 96,298 BTC, worth $6.070 billion. The dollar value fell 22.9%. The coin count rose 1.6%.
Almost the entire decline in open interest, in other words, was the price. Positions were repriced, not closed. Open interest peaked at 101,152 BTC on 13 November and slid to 92,007 BTC by 18 November, a 9% reduction in contracts across five sessions, before rebuilding 4.66% in a single day on 19 November.
That last number deserves attention. Adding 4,291 BTC of open interest in one session, with funding still positive and spot flat to lower, is leverage being re-established into weakness rather than withdrawn from it. It is consistent with traders selling rallies and re-levering on the way down, and it is the pattern that has produced every liquidation cascade this year. It does not prove another one follows. The largest single flush in this cycle, when shorts absorbed a $741 million liquidation day earlier this month, showed how quickly the two sides can swap places.
The Fed Put Hedge Fund Leverage at the Centre of Its Stability Review
The macro backdrop arrived two days before the funding data. The minutes of the 27–28 October FOMC meeting, published on 18 November, record a 10–2 decision to hold the target range at 3.75% to 4%, with both dissents running in the hawkish direction.
“Two members voted against the decision to maintain the target range for the federal funds rate, preferring an increase of 25 basis points in the target range at this meeting.”
The staff review put September PCE inflation at 3.6% and core PCE at 3.1%, both higher than a year earlier, with the increase attributed largely to tariffs, energy and the AI buildout. Participants were explicit that holding did not signal a softer reaction function.
“Many participants stressed the importance of clearly relaying the message that the decision to maintain the target range did not reflect a weakening of the Committee’s commitment to returning inflation to 2 percent in a timely manner.”
The same document contains a line that reads as though it were written about this market. In the financial stability discussion, the staff judged that leverage at hedge funds was among the most salient vulnerabilities in the system.
“Overall, the staff judged that current vulnerabilities could amplify shocks somewhat more than usual, with elevated asset valuations and leverage at hedge funds representing the most salient vulnerabilities, while strong bank and household balance sheets provided an important buffer against more severe outcomes.”
For crypto, the transmission is indirect but real. A higher-for-longer path raises the return available on cash, which raises the carry a basis desk needs to justify holding a hedged position, and it raises the cost of financing the spot leg. It also keeps pressure on the assets that were bought with leverage. The next scheduled FOMC meeting is 8–9 December, and the market-implied path in the minutes assigned high odds to a 25 basis point increase by year-end.
What 117 Historical Windows Say, Which Is Very Little
The obvious question is whether thirty days of positive funding in a falling market has ever marked a bottom. The answer, from the data available, is that it does not carry a reliable signal in either direction.
Over the 400 complete days since October 2025, there were 117 rolling thirty-day windows in which every day closed with positive funding and a further thirty days of price data existed to measure. Their median forward thirty-day return was +2.06%. The mean was −0.18%. Sixty-seven of the 117 were positive, and the range ran from −29.3% to +26.9%.
Those windows overlap, so they are not 117 independent observations. Sampling only the non-overlapping ones leaves six: −1.9%, +1.0%, −26.4%, +23.3%, +6.2% and −2.7%. Three of six were positive and the median was +1.0%, which is close enough to noise that no one should trade it. The December 2025 window preceded a 26% decline. The June 2026 window preceded a 23% rally.
The limitation is worth stating plainly: this is one exchange family’s funding history across a single year, with a small number of independent observations, in one macro regime. It describes positioning. It does not forecast direction.
The Levels and the Tells
Two prices frame the next move. The 18 November low of $62,006 is the immediate line; a daily close beneath it would put the 1 July low of $57,800 back in play. Above the market, the 200-day average sits at $72,777 and the 50-day at $78,669, with spot 12.5% below the 200-day. The gap is the measure of how much repair a trend reversal would need.
What would change the read on leverage is specific and observable. Three consecutive days of net-negative funding alongside falling open interest would be a genuine flush: positions paying to exit and contracts disappearing. The opposite combination, open interest rising while funding falls, would suggest new shorts absorbing the supply. Neither has happened yet. What has happened is open interest rebuilding, funding staying positive and price sitting 12.5% under its 200-day average.
Until funding prints a run of net-negative days alongside shrinking open interest, the positioning data describes a market in which longs are still paying to wait, not one in which they have been carried out.
Data: Bybit , OKX , CoinGecko , Alternative.me , Federal Reserve .
This article is for information only and is not investment advice. It describes positioning and market data as of 19 November 2026. Educational purposes only.
The post Bitcoin Fell 23% in a Month and Longs Kept Paying to Hold It appeared first on BlockchainReporter .