


Bitcoin tests $62,000, XRP gives up an intraday move above $1, and Venice gains 8%. November 19 price analysis tracks key levels for BTC, XRP, VVV, LIT and HYPE.
| Asset | Latest USD price | Past 24 hours | Market-wide 24h volume | Market-cap rank |
|---|---|---|---|---|
| Bitcoin (BTC) | $63,488 | −1.44% | $31.95 billion | 1 |
| XRP | $0.97327 | −0.63% | $1.74 billion | 6 |
| Venice Token (VVV) | $22.49 | +8.04% | $46.11 million | 67 |
| Lighter (LIT) | $2.77 | −3.39% | $46.53 million | 87 |
| Hyperliquid (HYPE) | $67.59 | −1.22% | $826.60 million | 10 |
Bitcoin Comes Within $30 of Sunday’s Low as RSI Falls to 21.81
Bitcoin closed Wednesday down 2.92% at $62,984.60. Its session high of $64,928.10 fell short of Tuesday’s $65,378.70. Its $62,000 low came within 0.05% of Sunday’s $61,970.30 trough. Buyers defended the weekend low, but the rebound still left Bitcoin below Tuesday’s $63,272.30 low at the close.
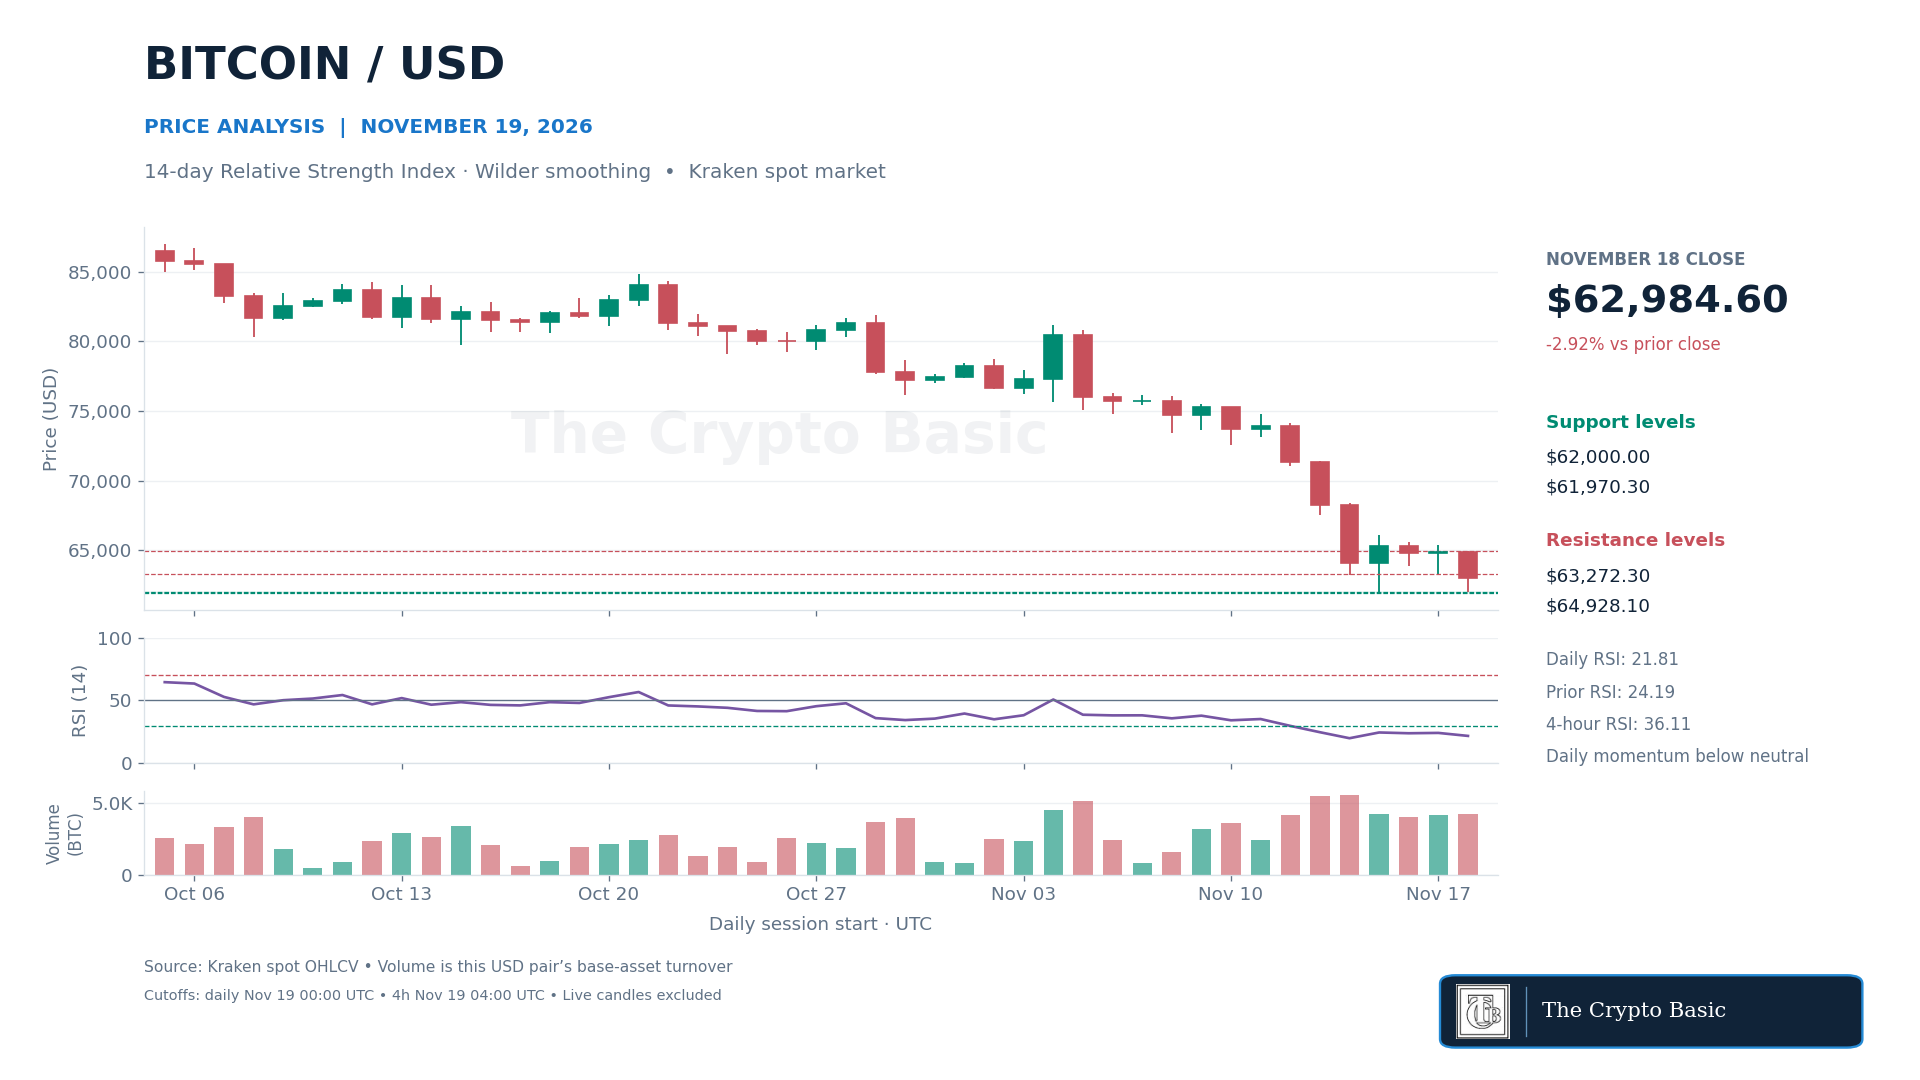
The 14-day relative strength index fell from 24.19 to 21.81, deeper into oversold territory. Thursday’s first four-hour candle closed at $63,135.20. Bitcoin subsequently rose to $63,488, back above Tuesday’s low but below the $64,994 recorded in Tuesday’s Bitcoin analysis .
A daily close above $63,272.30 would recover the first lost level. Clearing $64,928.10 would give the rebound more weight. A close below $61,970.30 would break the weekend floor and bring the July 13 low at $61,765 into view.
XRP Trades Above $1 But Loses $0.97914 at the Close
XRP reached $1.00677 on Wednesday, clearing both Tuesday’s $0.99073 high and the dollar mark intraday. By the close, XRP had fallen to $0.96649, down 1.64%. That settled the immediate support test identified in Wednesday’s XRP analysis . Buyers failed to hold Sunday’s $0.97914 high.
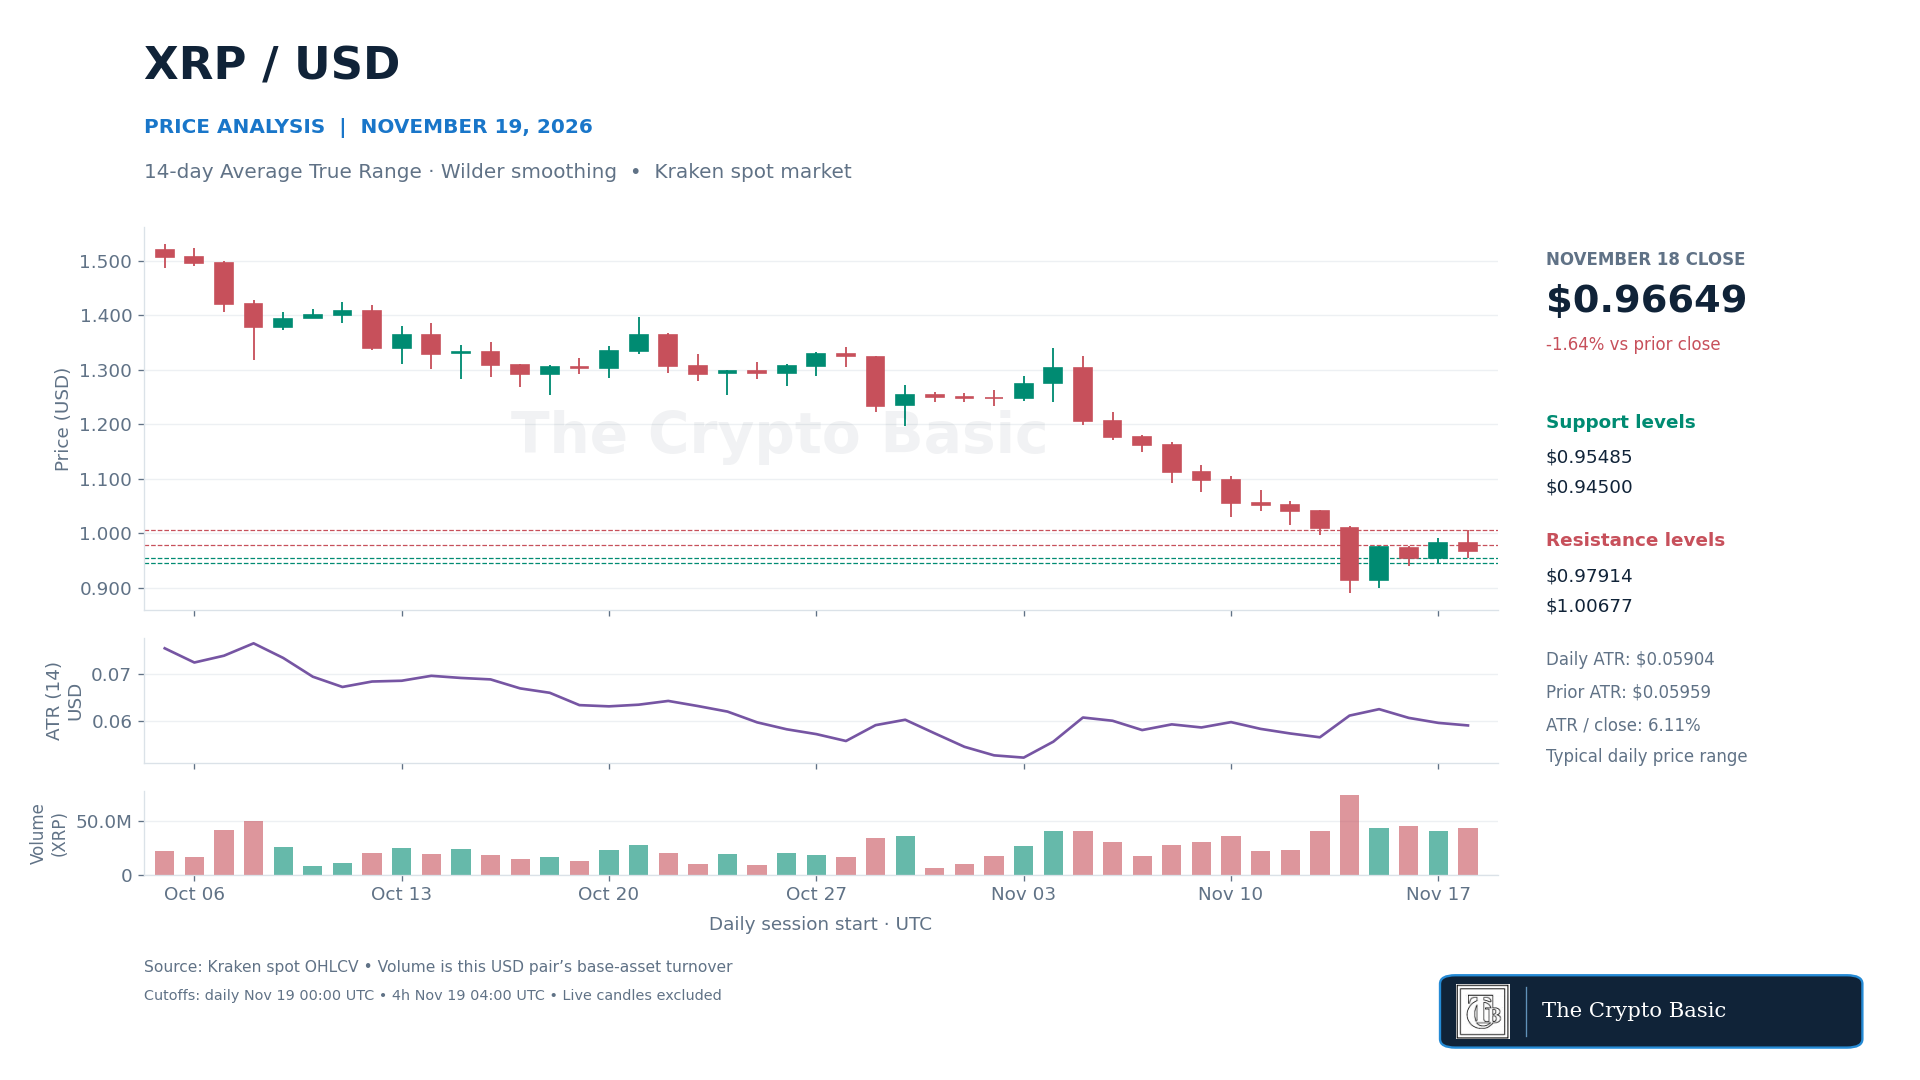
The 14-day average true range eased to $0.05904, or 6.11% of the close. Against a typical daily swing of nearly six cents, Wednesday’s move less than one cent above $1 was small. Thursday’s first four-hour session reached $0.95363 before closing at $0.96817.
A daily close back above $0.97914 would restore the first recovery level. Closing above $1.00677 would clear Wednesday’s entire reversal. A close below $0.95363 would weaken the latest bounce and put Tuesday’s $0.94500 low in focus.
Venice Gains 8% as its Four-Hour Close Clears Wednesday’s High
Venice Token rose 2.91% on Wednesday to close at $21.678. Around 120,254 VVV traded on the USD pair, 38% above its preceding 20-session average. Buyers took VVV to $22.037 intraday, yet the daily close fell just $0.028 short of the November 10 high at $21.706.
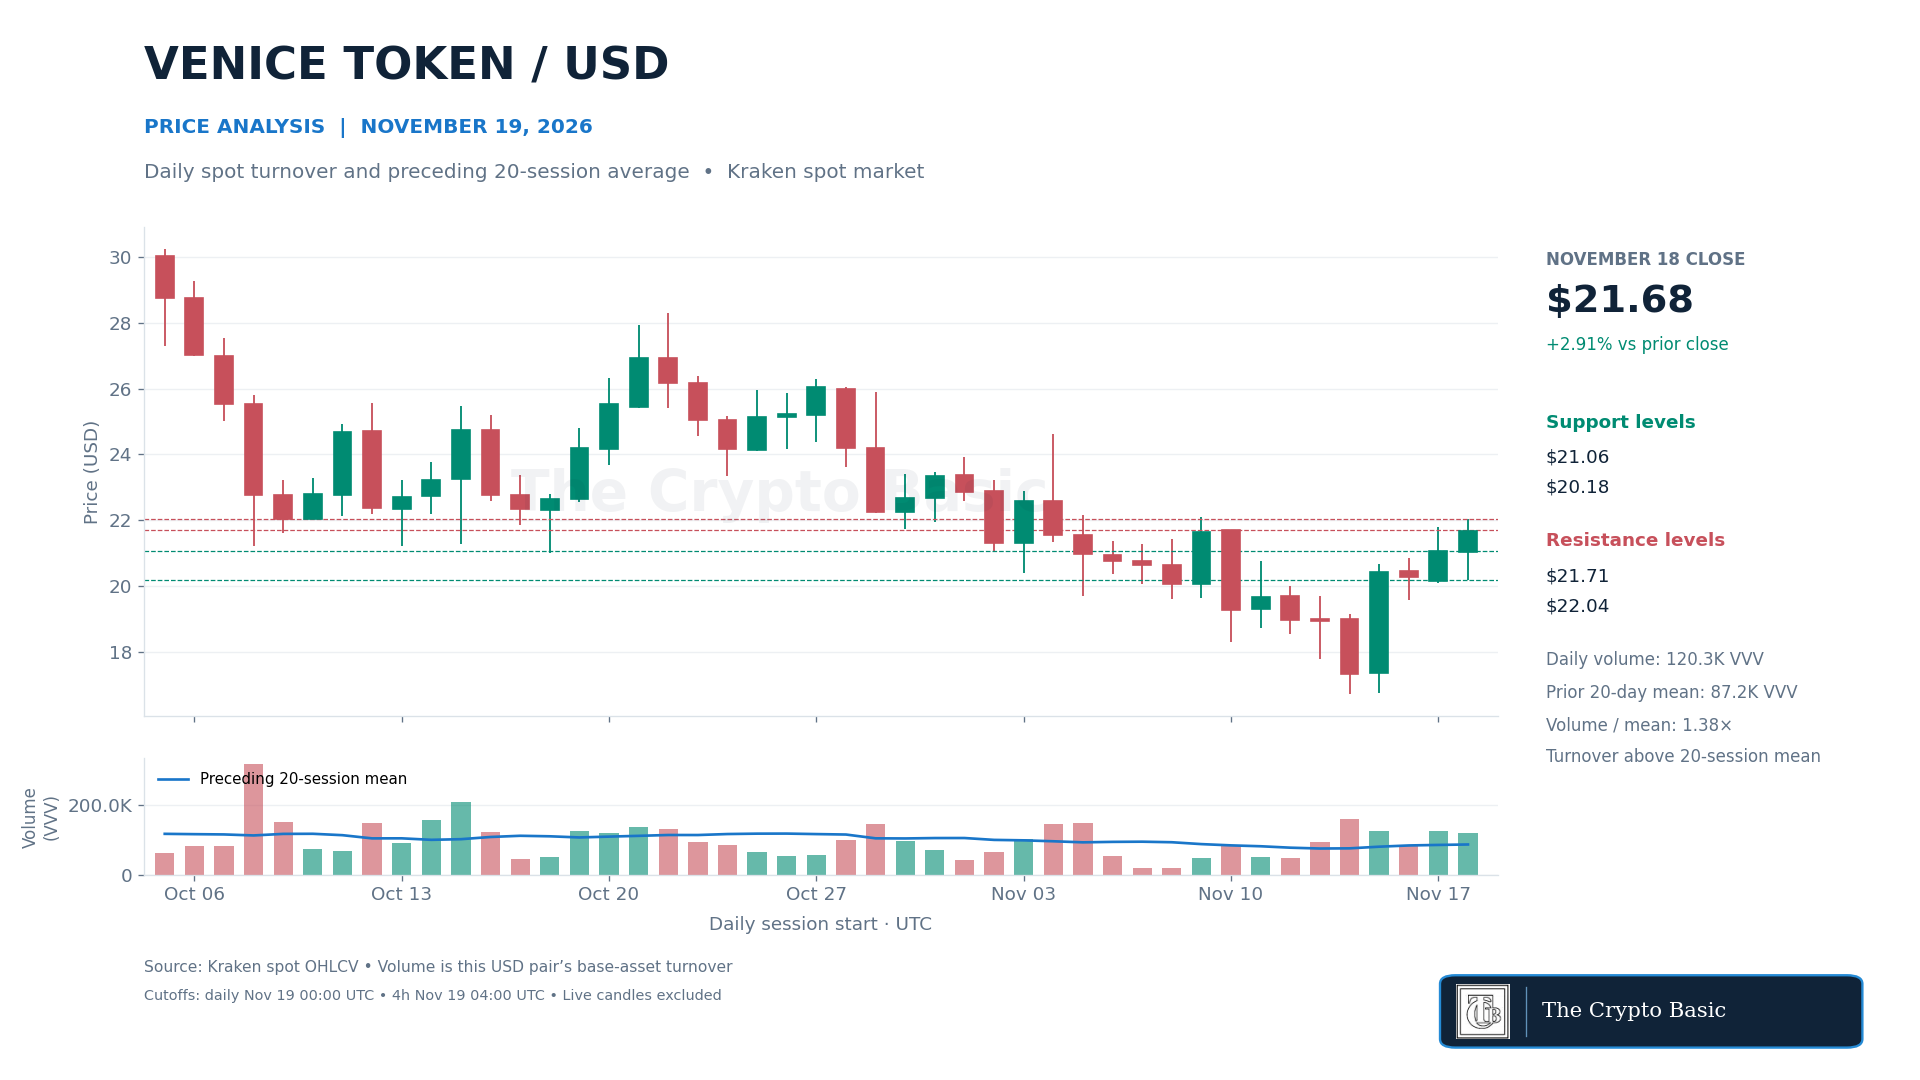
The next four hours changed the short-term picture. VVV reached $22.40 and closed at $22.27, above both $21.706 and Wednesday’s high. By 05:11 UTC, it traded at $22.49. The four-hour breakout was confirmed, while Thursday’s daily candle remained open.
A daily close above $22.037 would confirm that buyers held Wednesday’s high through the session. The November 3 high at $22.89 would then be a nearby reference. A retreat below $21.706 would weaken the move. Losing Tuesday’s $21.064 close would put Wednesday’s $20.179 low back in play.
Lighter Recovers its Lower Bollinger Band After a 5.81% Decline
Lighter fell from $2.893 to $2.725 on Wednesday. The session low of $2.669 took LIT beneath its daily lower Bollinger Band near $2.700, but buyers recovered the band by the close. LIT still finished near the bottom of the range, with its 20-day average overhead at $3.133.
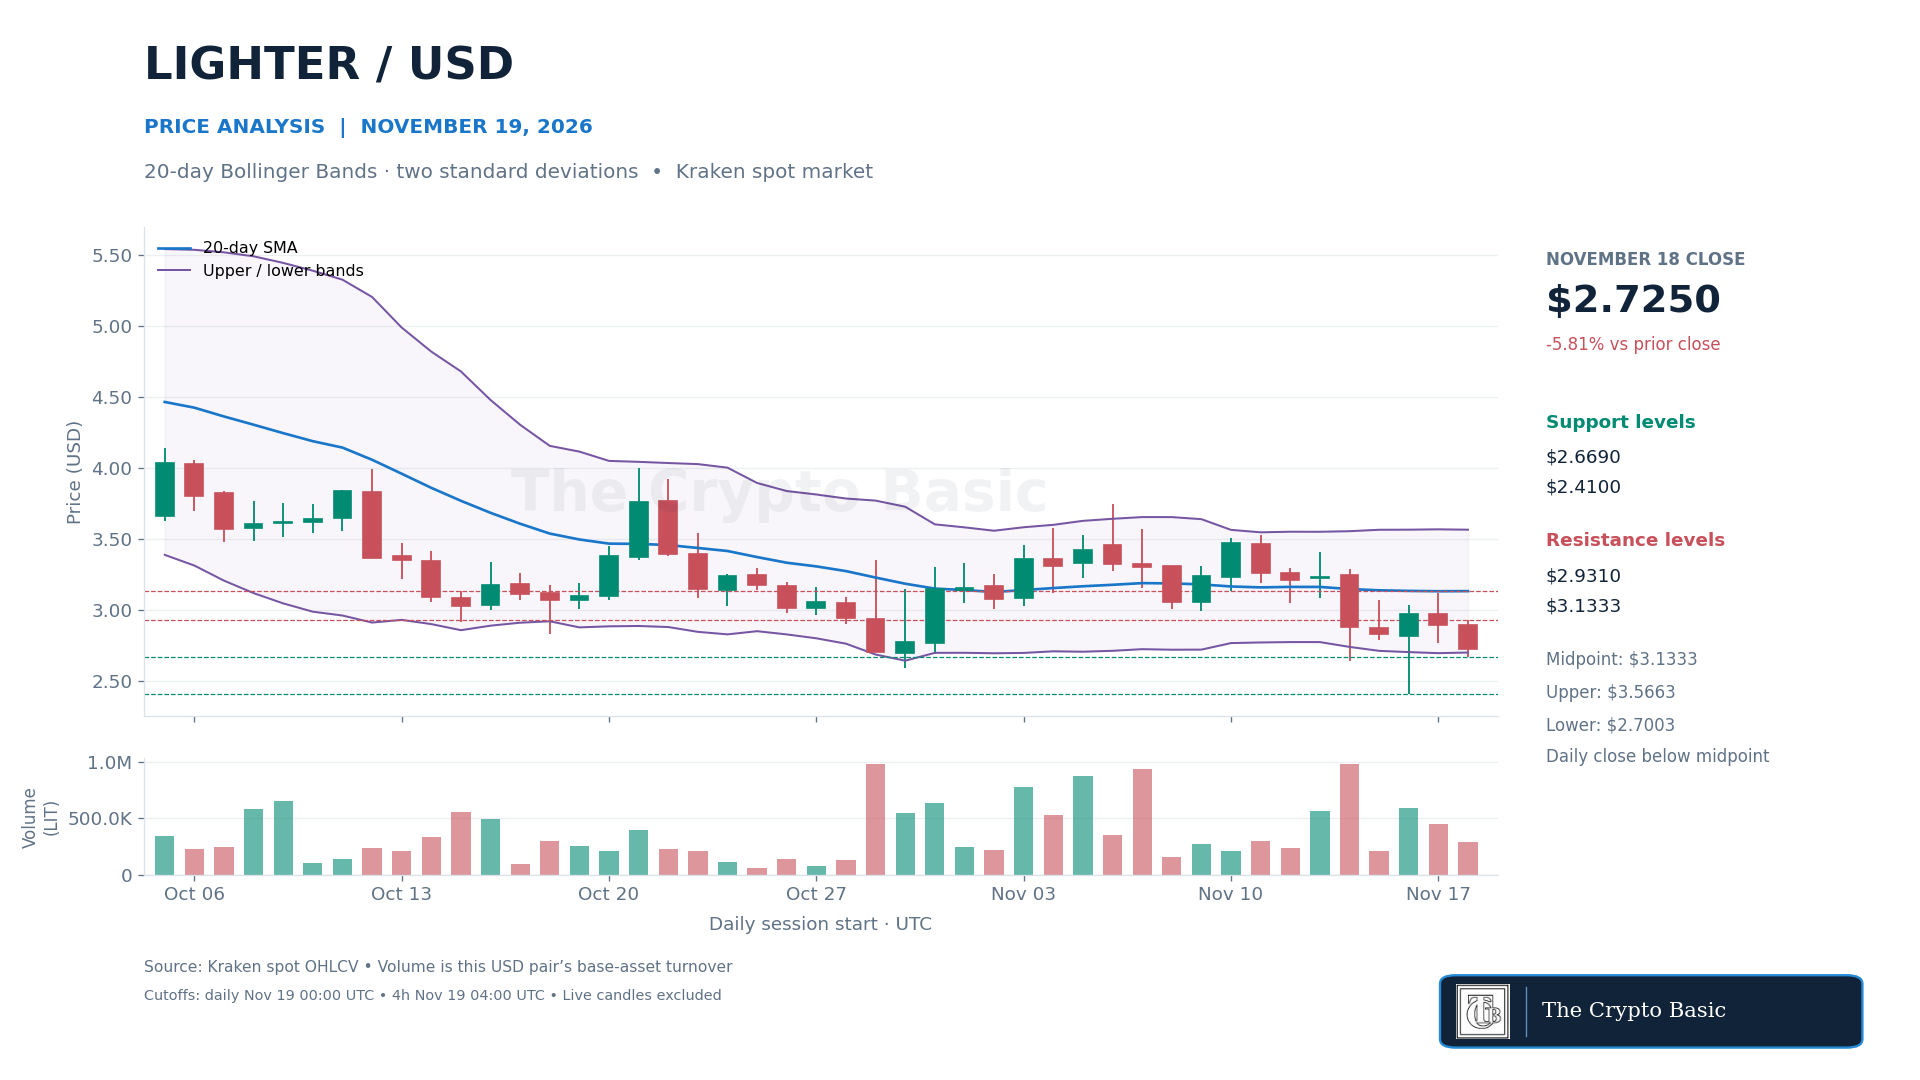
Thursday’s first four-hour candle revisited the low, reaching $2.667 before closing at $2.778. That close remained below the four-hour midpoint at $2.826, leaving buyers with another hurdle after defending the lows a second time.
A daily close above $2.931 would clear Wednesday’s high. Tuesday’s $3.123 high and the $3.133 daily midpoint would then form a narrow resistance area. A close below $2.667 would break the two-session floor, with Saturday’s $2.643 low next. Below that level, Monday’s $2.410 low is the larger support.
Hyperliquid Loses $67 as the Daily MACD Gap Narrows
Hyperliquid fell 4.39% to close Wednesday at $66.87. Sellers took HYPE from a high of $69.94 to a low of $65, just $0.25 above Monday’s low. Thursday’s first four-hour candle closed at $67.28, recovering $67 while leaving most of Wednesday’s decline intact.
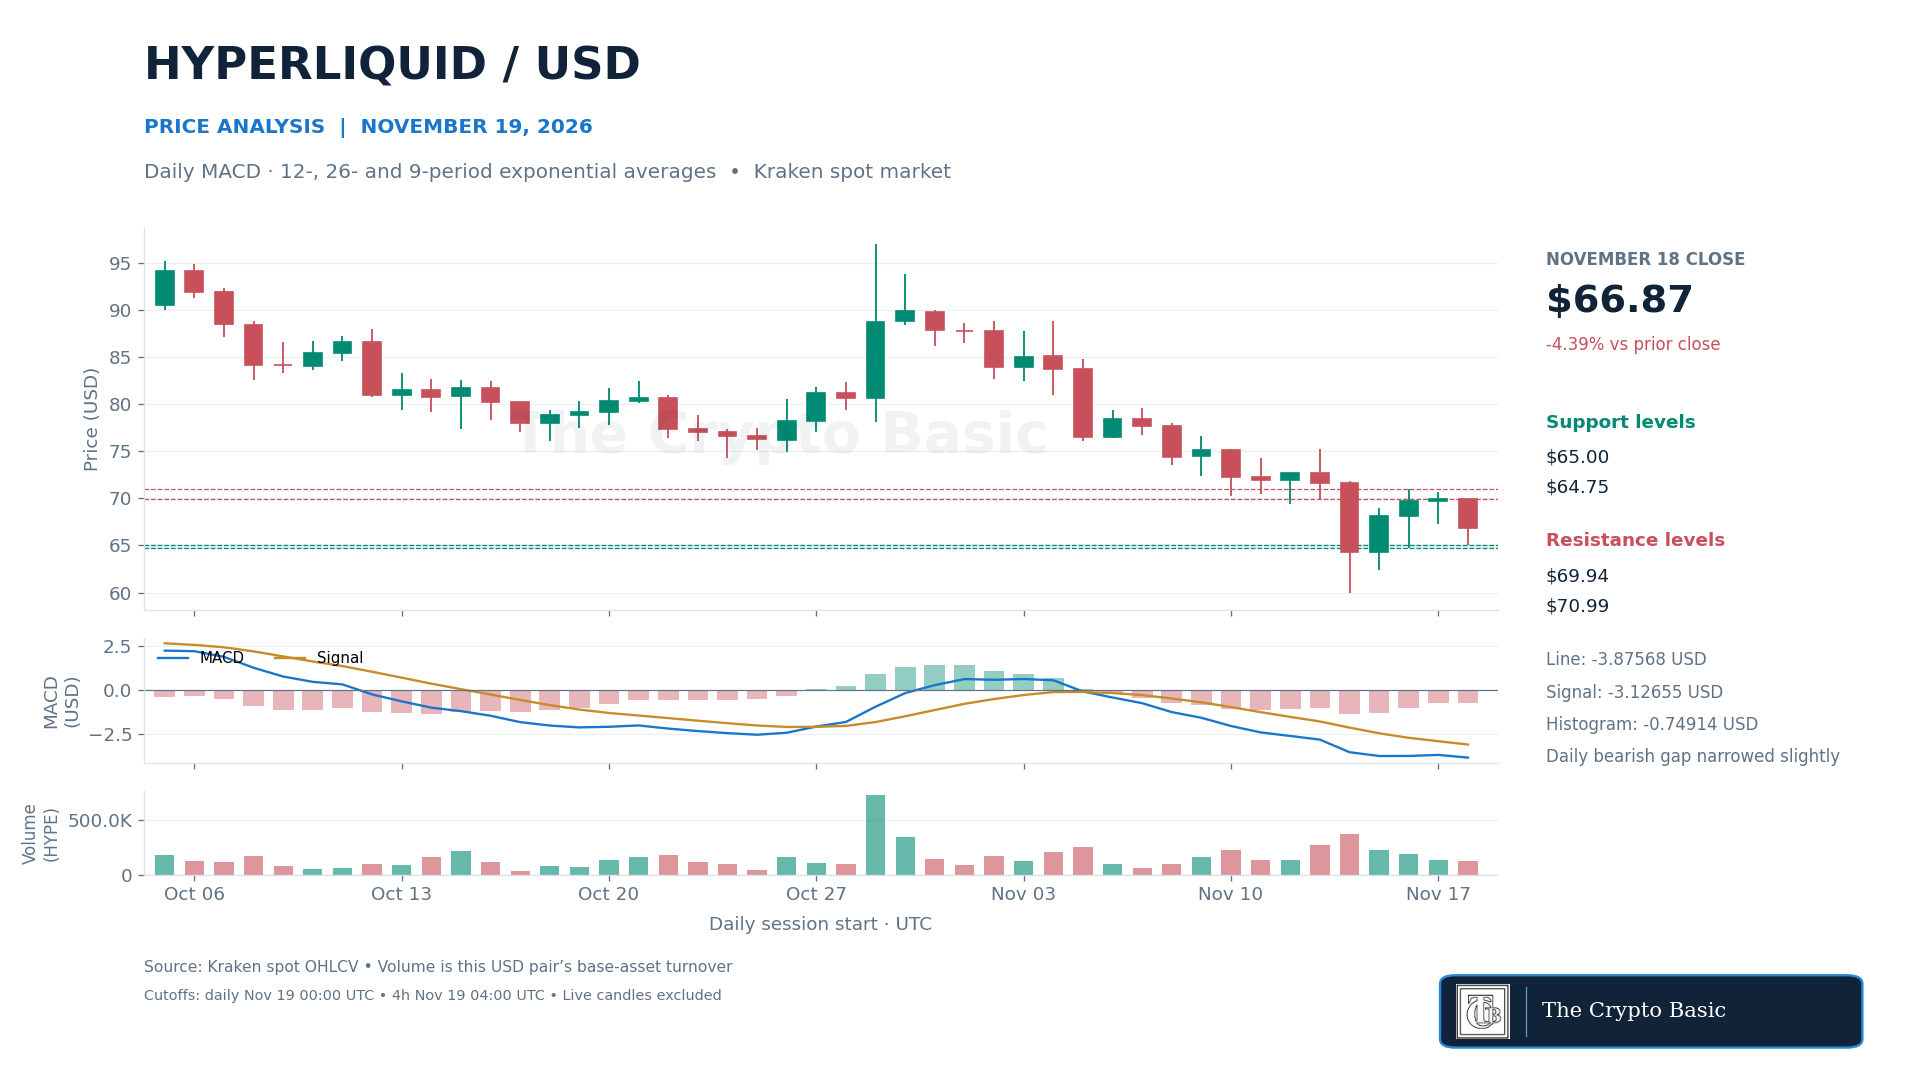
Daily MACD, calculated with 12- and 26-day exponential averages and a nine-day signal, fell to −3.876. Its signal fell to −3.127. The histogram narrowed from −0.781 to −0.749 because the signal line also moved lower. The gap between the lines shrank even as the MACD line fell further below zero.
A daily close above $69.94 would erase Wednesday’s closing loss and bring Monday’s $70.99 high into view. A close below the $64.75–$65 support area would expose Sunday’s $62.38 low. Saturday’s $60 low remains the broader test if that support gives way.