




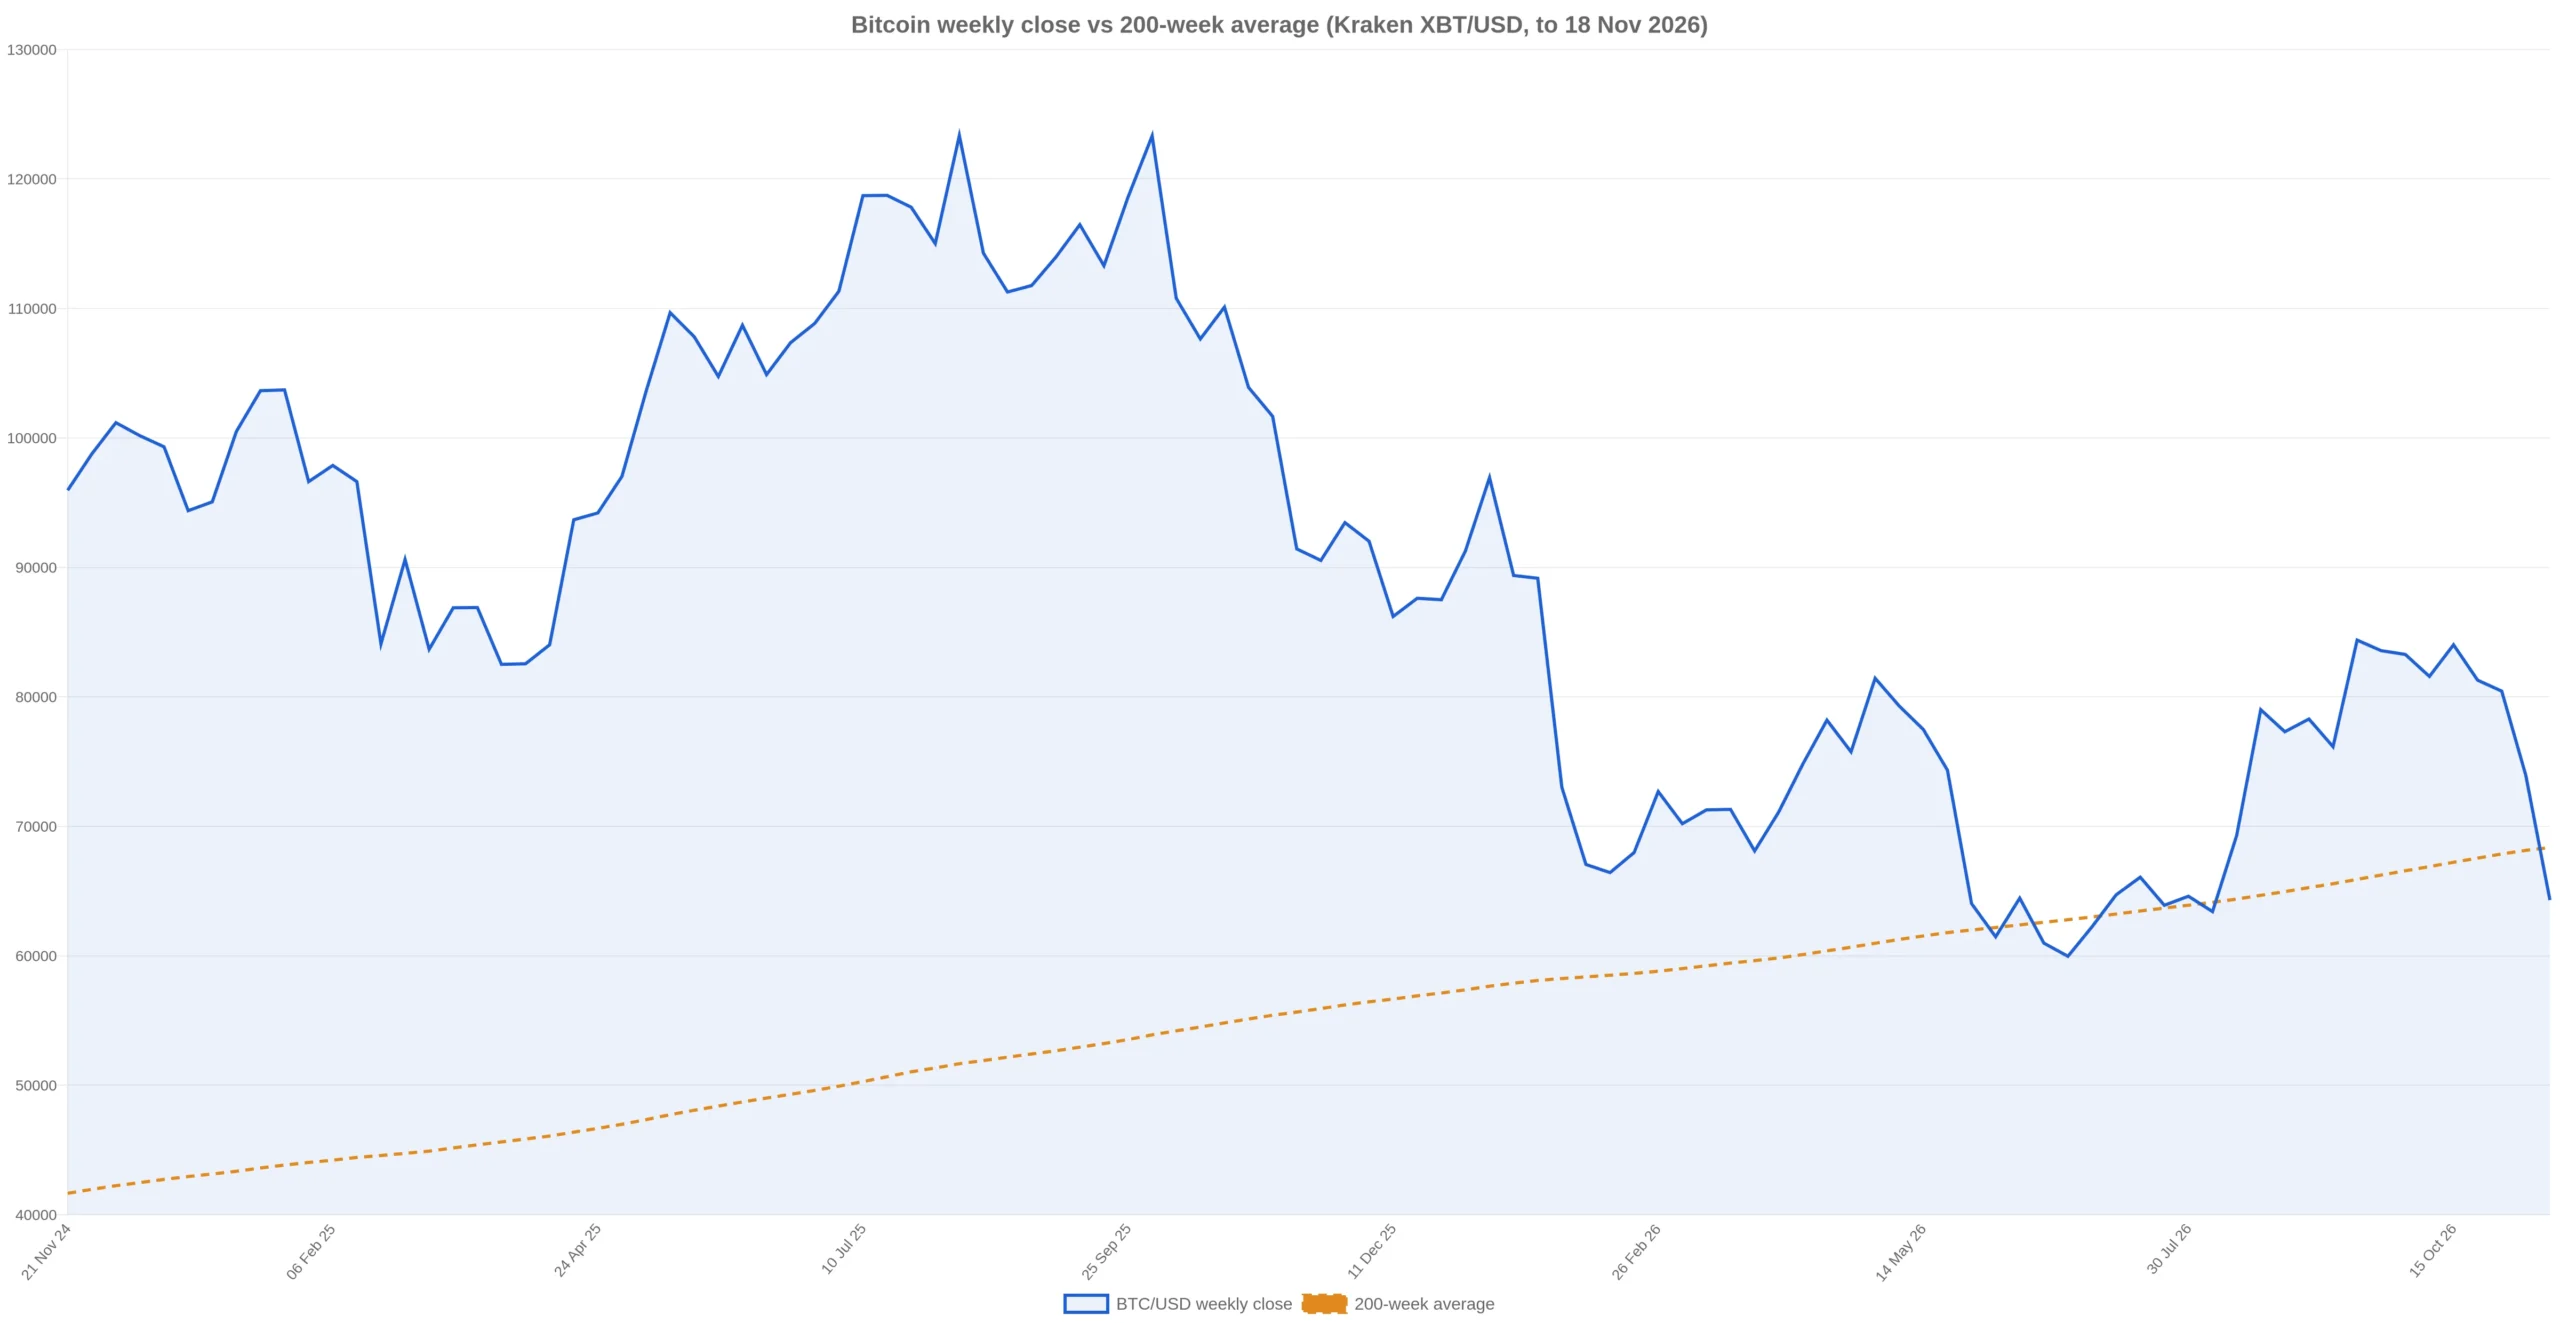
Bitcoin trades at $64,641, 5.1% below its 200-week average of $68,144.98, according to Kraken’s XBT/USD weekly series read at 05:48 UTC on 18 November. The average is still climbing while the price falls. Thursday’s weekly close decides whether that becomes the first completed close below the line since October 2023.
The rest of the data is less ambiguous than the level itself. Ten of the twelve US spot ETF sessions since 2 November were negative, for a combined $2.58 billion of net outflows, per Farside Investors . Weekly RSI sits at 37.7, which is weak but not washed out. Bitcoin is 48.8% below its 2 October 2025 high of $126,198 on the same series, and 12.6% below the 5 November weekly close of $73,928.40.
A 200-Week Average Is 1,400 Days of Closes, Not a Trendline
The 200-week average is the mean of the last 200 weekly closes, which is roughly 3.8 years of prices. On Kraken’s weekly candles, which run Thursday to Thursday, the value of completed closes ending 5 November is $68,144.98. If the unfinished week is included at the current price, the figure rises to $68,363.10, because adding a $64,000 observation also drops a $37,000 one from late 2023.
Both versions describe the same thing. The line is not a chart drawing with a chosen anchor point. It is an arithmetic average that reprices every Thursday, and it has been rising through the entire decline.
That is why the gap matters more than the level. On 8 October the average was $66,887.40 and Bitcoin closed the week at $81,576.40, 22.0% above it. Four weekly closes later the average stood at $68,144.98 and the price was $73,928.40, only 8.5% above it. The line gained $314 a week while the price fell $1,912 a week. A flat price against a line rising $314 loses about 0.46 percentage points of cushion every week.
Reclaiming the completed-close average from here takes a 5.4% move. Holding the current gap while the average keeps rising takes nothing at all.
Nine Breaches Since 2017, and Only One of Them Was Deep
The 200-week average became computable on Kraken’s series in August 2017. Since then Bitcoin has closed below it in nine separate stretches, including the current one. Of the 486 weeks in that window, 52 closed below the line, or 10.7%.
| Period of weekly closes | Weeks below | Deepest close vs average | Lowest price |
|---|---|---|---|
| 12 March 2020 | 1 | -1.8% | $3,913 |
| 16 June to 7 July 2022 | 4 | -11.2% | $17,600 |
| 28 July 2022 | 1 | -0.4% | $22,488 |
| 18 August 2022 to 9 March 2023 | 30 | -33.8% | $15,470 |
| 1 to 8 June 2023 | 2 | -5.3% | $24,818 |
| 17 August to 5 October 2023 | 8 | -7.0% | $24,800 |
| 4 June to 2 July 2026 | 4 | -4.5% | $57,740 |
| 6 August 2026 | 1 | -1.1% | $63,137 |
| 12 November 2026, in progress | 1 | -5.9% | $61,970 |
Four of the eight completed breaches ended within two weeks. The median was three weeks. Then there is the 2022-23 case, which ran 30 weeks, bottomed at a close 33.8% below the average on 3 November 2022, and did not produce a close back above the line until 9 March 2023.
The distribution is the point. A break below the line has been a poor timing signal in both directions. Four of eight times it was over almost immediately. One time it preceded another 34% of downside measured against the average.
The 2026 breaches have all been shallow so far: -4.5% in June, -1.1% in August, and -5.9% at present. Every one of them was bought back within four weeks or less.
The 2022-23 episode is the useful comparison, because both sides of the ratio moved. Bitcoin entered that breach on 18 August 2022 at a close of $21,375, 7.7% under an average of $23,163. It spent 30 weeks below the line, bottomed at a close of $15,864 against an average of $23,977, and exited on 9 March 2023 with a close of $24,373, still 4.0% below the line but above where it entered. The average itself rose 9.6% during the breach, from $23,163 to $25,380. A holder who waited for the reclaim bought back 14% higher than the entry price of the breach, not lower.
Who Was Selling While the Line Was Rising
The flow data explains the shape of the decline better than any single headline. From 2 November through 17 November, US spot bitcoin ETFs recorded ten negative sessions out of twelve and a net $2.58 billion of outflows. That is roughly 40,100 coins at the current price, or 0.20% of Bitcoin’s $1.29 trillion market capitalisation.
The concentration is worth noting. On 17 November the complex lost $239.9 million net, of which iShares’ IBIT accounted for $209.5 million and Grayscale’s GBTC for $17.7 million. Two funds carried 94.7% of the day’s outflow. The smaller issuers, including Grayscale’s mini trust and Morgan Stanley’s MSBT, took in small positive amounts. On 30 October the complex lost $643.2 million in a single session, the largest single day in this stretch.
None of that reverses the cumulative picture. Since launch, IBIT has absorbed $64.06 billion net and the whole complex $54.47 billion, against $28.20 billion of redemptions from GBTC. November’s $2.58 billion is a 4.7% dent in the cumulative total, not a reversal of it.
What it does show is a marginal buyer that has stopped buying at the same time as the average has kept rising. The corporate treasuries that replaced some of that bid are now underwater: Strategy’s all-in average is $75,452 against a $64,641 spot price, a gap covered in our reading of the 8-K filings this week .
What the Fed Said, and What It Did Not Say
Governor Christopher Waller’s speech on 17 November at The Clearing House annual conference was not about bitcoin’s chart. It was about tokenised markets, and it is the most senior official commentary this month on the accountability questions raised by the October breach at Binance.
Waller framed the problem in operational terms. As traditional assets move onto blockchains, he said, “tokenized services raise new questions about accountability.” He then listed them: “Who bears responsibility when fraudsters take advantage of the automatic execution of smart contracts?”
His conclusion on the Binance episode was one sentence inside a longer passage on trust. “The recent events around Binance have highlighted some of the issues that can arise from programmable blockchains,” he said, adding that “trust is built when transactions occur reliably and securely, both within and across platforms. It is hard to win and easy to lose.”
The speech does not argue that the breach caused the selloff, and nothing in the record establishes that chain. What it does establish is that a Federal Reserve governor treated the incident as evidence for a governance gap in tokenised finance, in a speech delivered to an audience of payments and settlement executives. The Justice Department’s seizure case against $1.2 billion of the proceeds is the other half of that institutional response, documented in our report on the court order .
For a holder, the link to price is indirect and should be labelled as such. A governance shock raises the discount rate an allocator applies to the asset class. It does not set a price level, and it is not measurable in the way ETF flows are.
The Case Against Reading This as a Bottom
The 200-week average is a lagging average of a single series. It has no causal mechanism, and its apparent reliability rests on a sample of eight completed episodes, six of which occurred while Bitcoin’s market was a fraction of its current size. Extending the history backwards is not possible on this data set, because Kraken’s series does not have 200 weeks of history before August 2017.
There is also a mechanical point. The average is rising because the values it drops from 2023 are lower than the values it adds. That process runs out, but not soon. If Bitcoin stays at $64,000, the line keeps climbing for another 64 weeks, because every week it discards over that stretch closed below $64,000; the first discarded week priced above the current level is the week of 4 November 2021, which closed at $64,969.
Funding and positioning would settle the argument faster than the average does, and the available evidence here is incomplete: the 14-week RSI at 37.7 is above the 30 level that would mark a washout, and the 50-week average at $75,063.66 is falling $1,940 every five weeks with price 14.3% below it. That combination describes a downtrend in progress, not a completed capitulation.
The Levels That Carry a Basis
The first level is $68,144.98, the 200-week average of completed closes. A weekly close above it would invalidate the break. The second is $73,928.40, the 5 November weekly close, which is where the decline accelerated.
Below spot, the reference is $61,970.30, the low of the week beginning 12 November. A weekly close under that level puts the June 2026 low of $57,740 back in play. That low was set during the 4 June to 2 July breach and produced a 4.5% dip against the average before recovering.
These are chart levels taken from Kraken weekly candles, not forecasts. They are useful because they are falsifiable: either the week closes above or below them, and the reading changes accordingly.
What Thursday’s Close Settles
Kraken’s weekly candle for this period closes at 00:00 UTC on 19 November. If Bitcoin finishes below $68,144.98, it will be the first completed weekly close under the average since 5 October 2023, the third separate breach of 2026, and the first one to arrive with ten negative ETF sessions behind it.
If it finishes above, the entire signal evaporates and the only thing that happened is a 13% drawdown inside an intact trend. Both outcomes are still live with one session to go, which is the honest state of the evidence at $64,641.
Data: Kraken , CoinGecko , Farside Investors , Federal Reserve .
This article is for information only and is not investment advice. The 200-week average is calculated from Kraken XBT/USD weekly closes as of 05:05 UTC on 18 November 2026, and the current week is still open.
The post Bitcoin Is 5.1% Below Its 200-Week Average, One Day Before the Weekly Close Decides It appeared first on BlockchainReporter .