


Bitcoin holds near $65,000 as XRP stays close to its lower band, while Hyperliquid and Venice lead gains in the November 17 crypto market analysis today.
| Asset | Latest USD price | Past 24 hours | Market-wide 24h volume | Rank |
|---|---|---|---|---|
| Bitcoin (BTC) | $64,994 | −0.02% | $32.81 billion | 1 |
| XRP | $0.967085 | +0.57% | $1.66 billion | 6 |
| Uniswap (UNI) | $5.27 | +1.27% | $307.95 million | 28 |
| Hyperliquid (HYPE) | $70.27 | +5.75% | $1.47 billion | 10 |
| Venice Token (VVV) | $21.19 | +5.69% | $47.83 million | 67 |
Bitcoin MACD remains bearish as the histogram narrows slightly
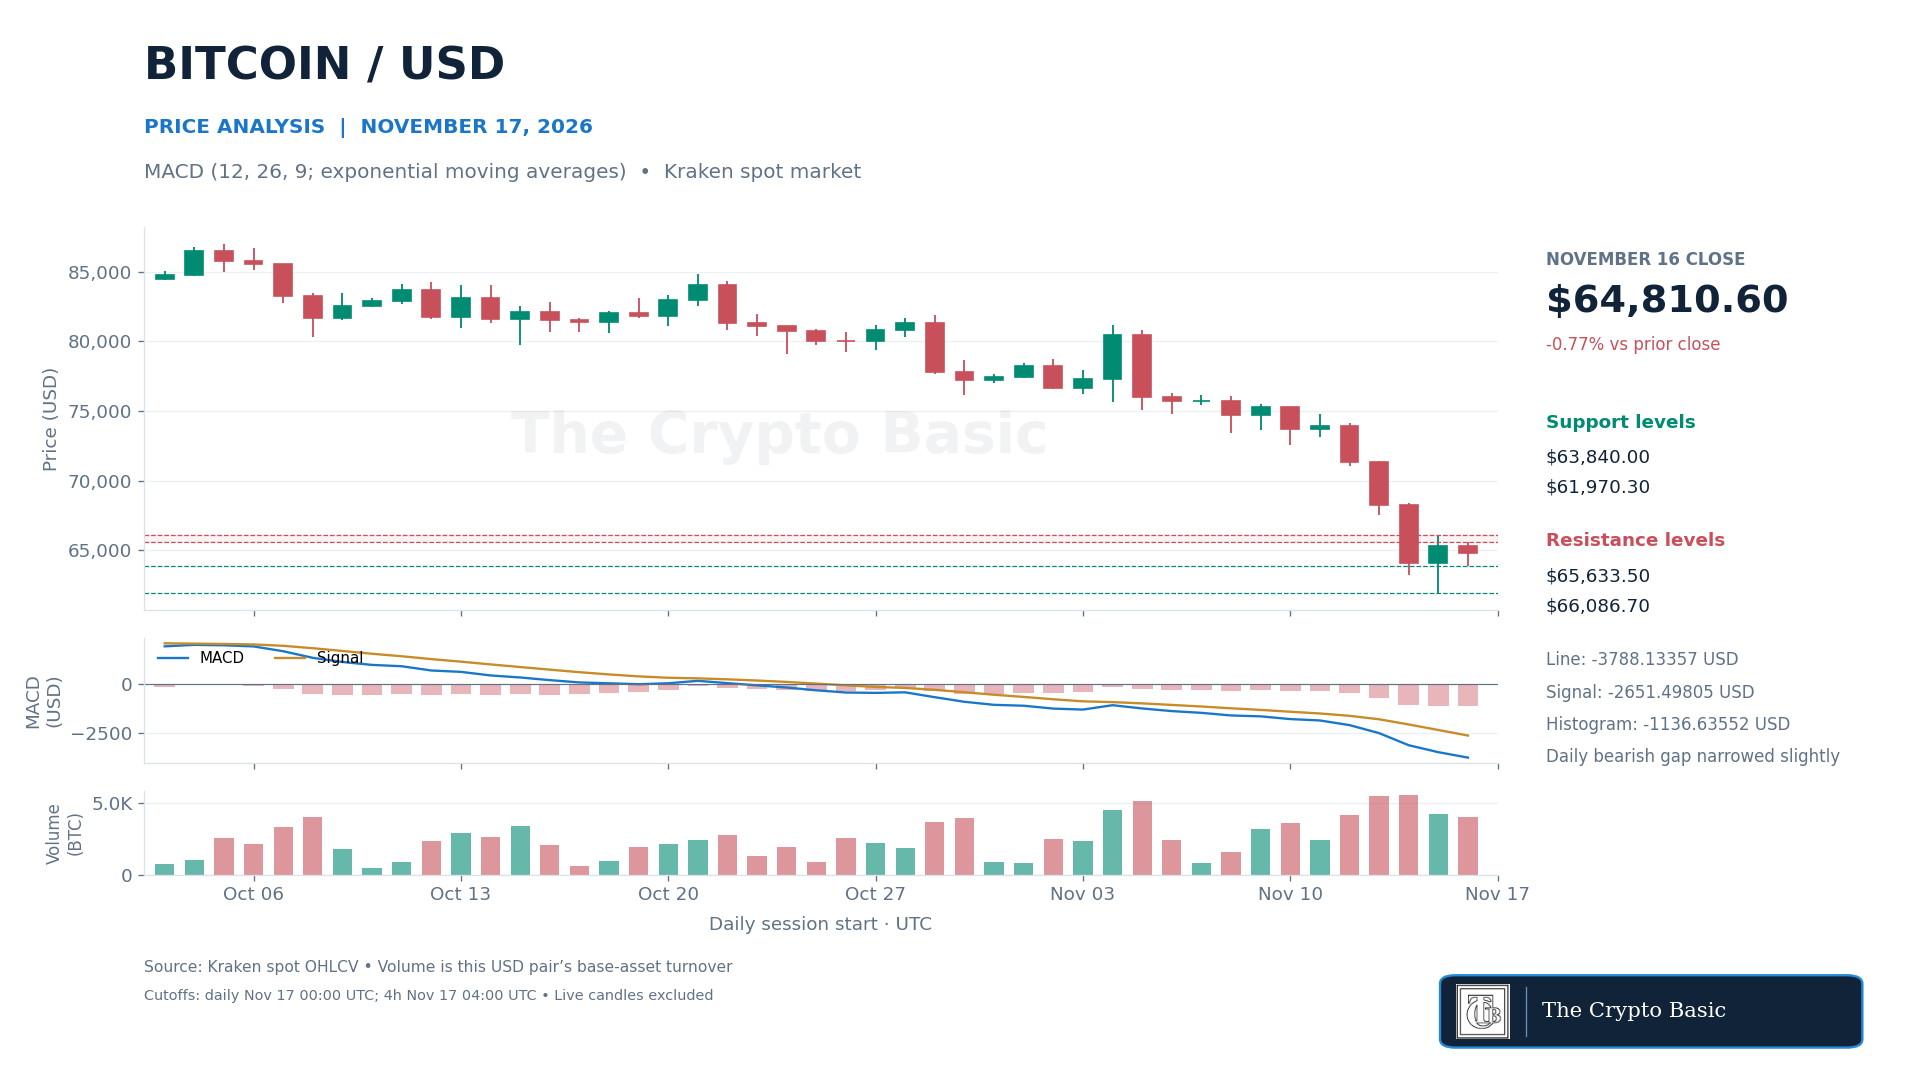
Bitcoin fell 0.77% on Monday to close at $64,810.60 after trading between $63,840 and $65,633.50. The close held above Sunday’s $61,970.30 low but failed to clear Sunday’s $66,086.70 high, leaving the short-term rebound inside that range.
The latest price was almost unchanged from the $65,017 recorded in Monday’s Bitcoin analysis .
Daily MACD uses 12- and 26-period exponential moving averages with a nine-period signal EMA. The MACD line fell to −$3,788.13, while the signal declined to −$2,651.50.
The histogram improved slightly to −$1,136.64 from −$1,140.97. That small contraction shows that bearish momentum stopped accelerating, but the MACD line remained below its signal and no bullish crossover was confirmed on the completed candle.
The latest completed four-hour candle was more constructive. It closed at $64,992.20 with the MACD line above its signal and a positive $293.40 histogram.
A daily close above $65,633.50 would clear Monday’s high, while a close above $66,086.70 would strengthen the rebound. A close below $63,840 would weaken the hold; losing $61,970.30 would confirm another downside extension.
XRP Remains Near its Lower Bollinger Band
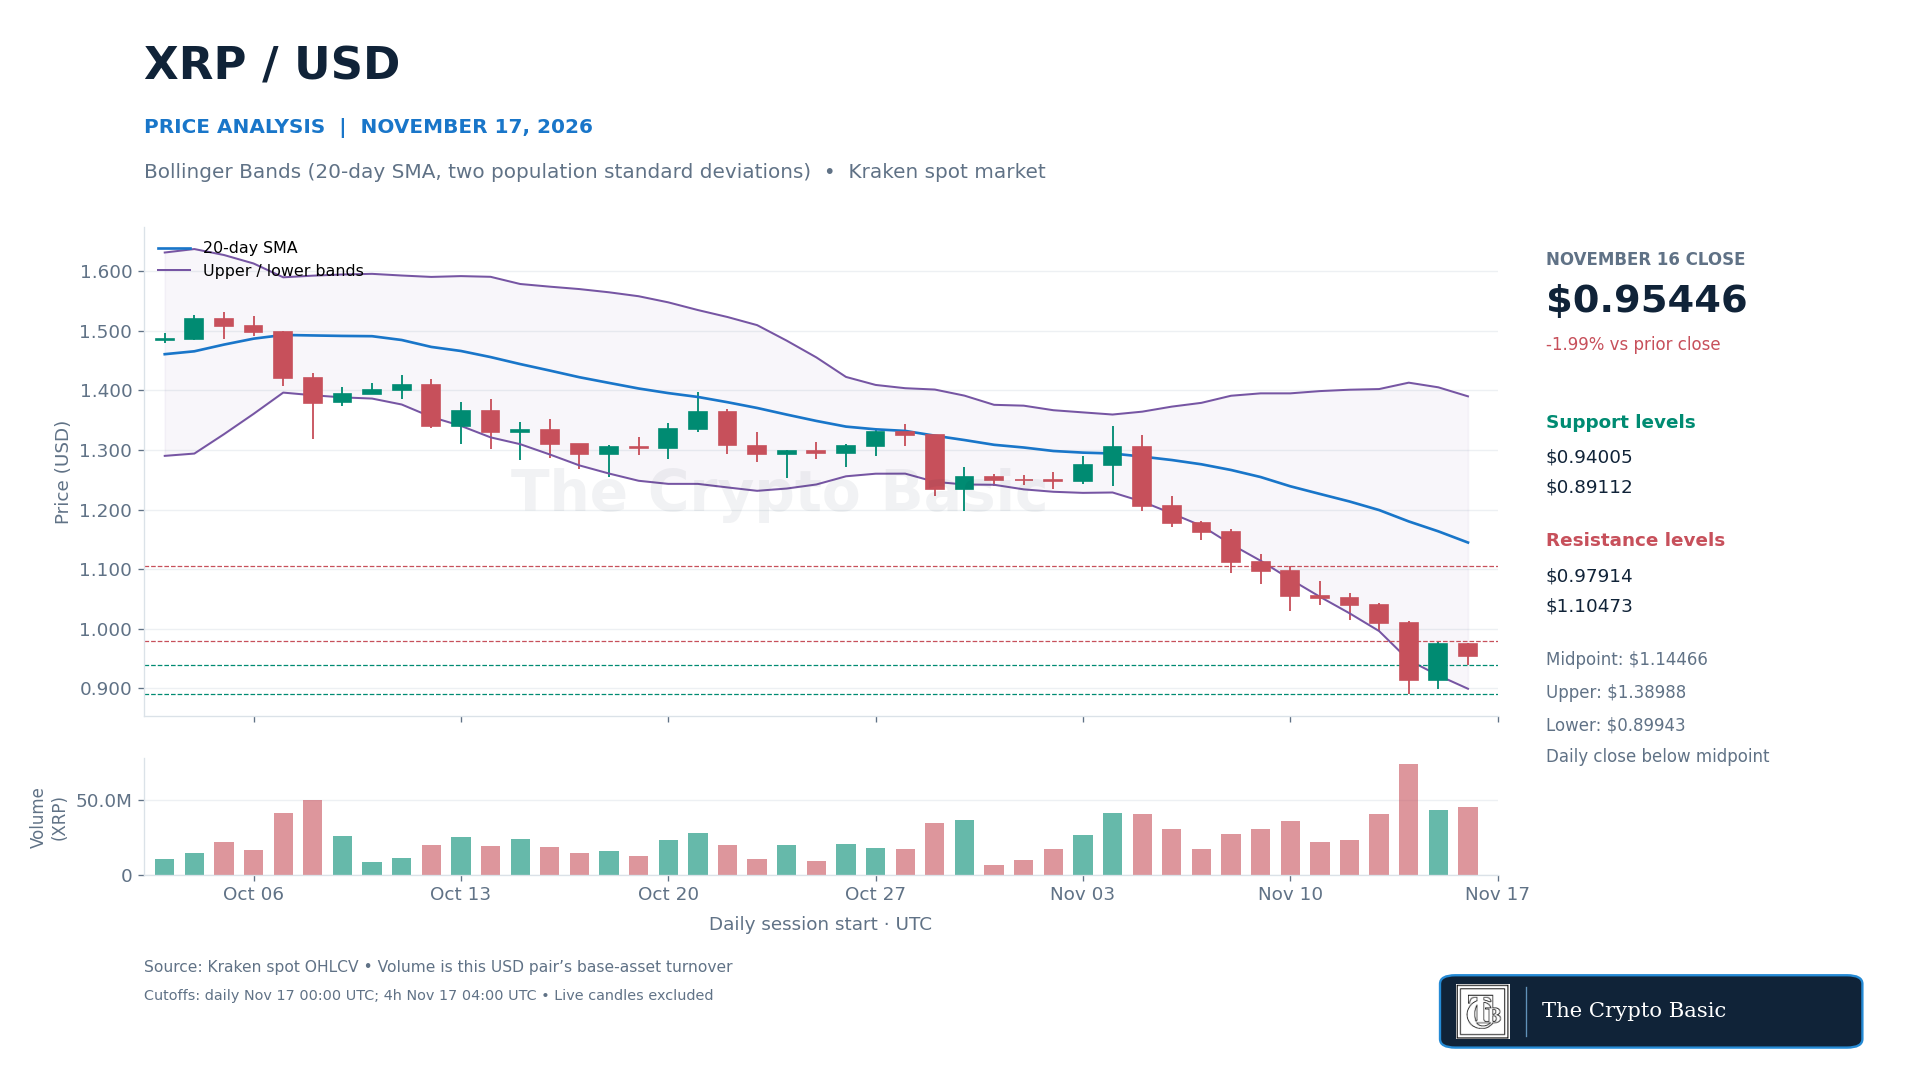
XRP fell 1.99% on Monday to close at $0.95446 after ranging from $0.94005 to $0.97648. The latest price was 3.58% below the $1.003 recorded in the November 13 XRP analysis .
XRP was nevertheless up 0.57% over the past 24 hours. The positive 24-hour change and Monday’s decline cover different periods: one is a moving 24-hour window, while the other compares completed UTC closes.
Daily Bollinger Bands use a 20-day simple moving average and two population standard deviations. The midpoint fell to $1.14466, with the upper band at $1.38988 and the lower band at $0.89943.
XRP closed inside the envelope and above the lower band but remained far below the midpoint, showing that the broader trend is still weak.
The completed four-hour candle closed at $0.96658, just above its $0.96450 midpoint and below the $1.00316 upper band. A daily close above $0.97914 would clear Sunday’s high and support a move toward $1.10473.
A close below $0.94005 would expose the lower-band area, while losing $0.89112 would invalidate the latest rebound and confirm a fresh 90-session low.
Uniswap RSI stays close to oversold
Uniswap slipped 0.39% on Monday to close at $5.1638 after trading between $5.0305 and $5.2557. The latest $5.27 price was 22.84% below the $6.83 recorded in the November 9 Uniswap analysis .
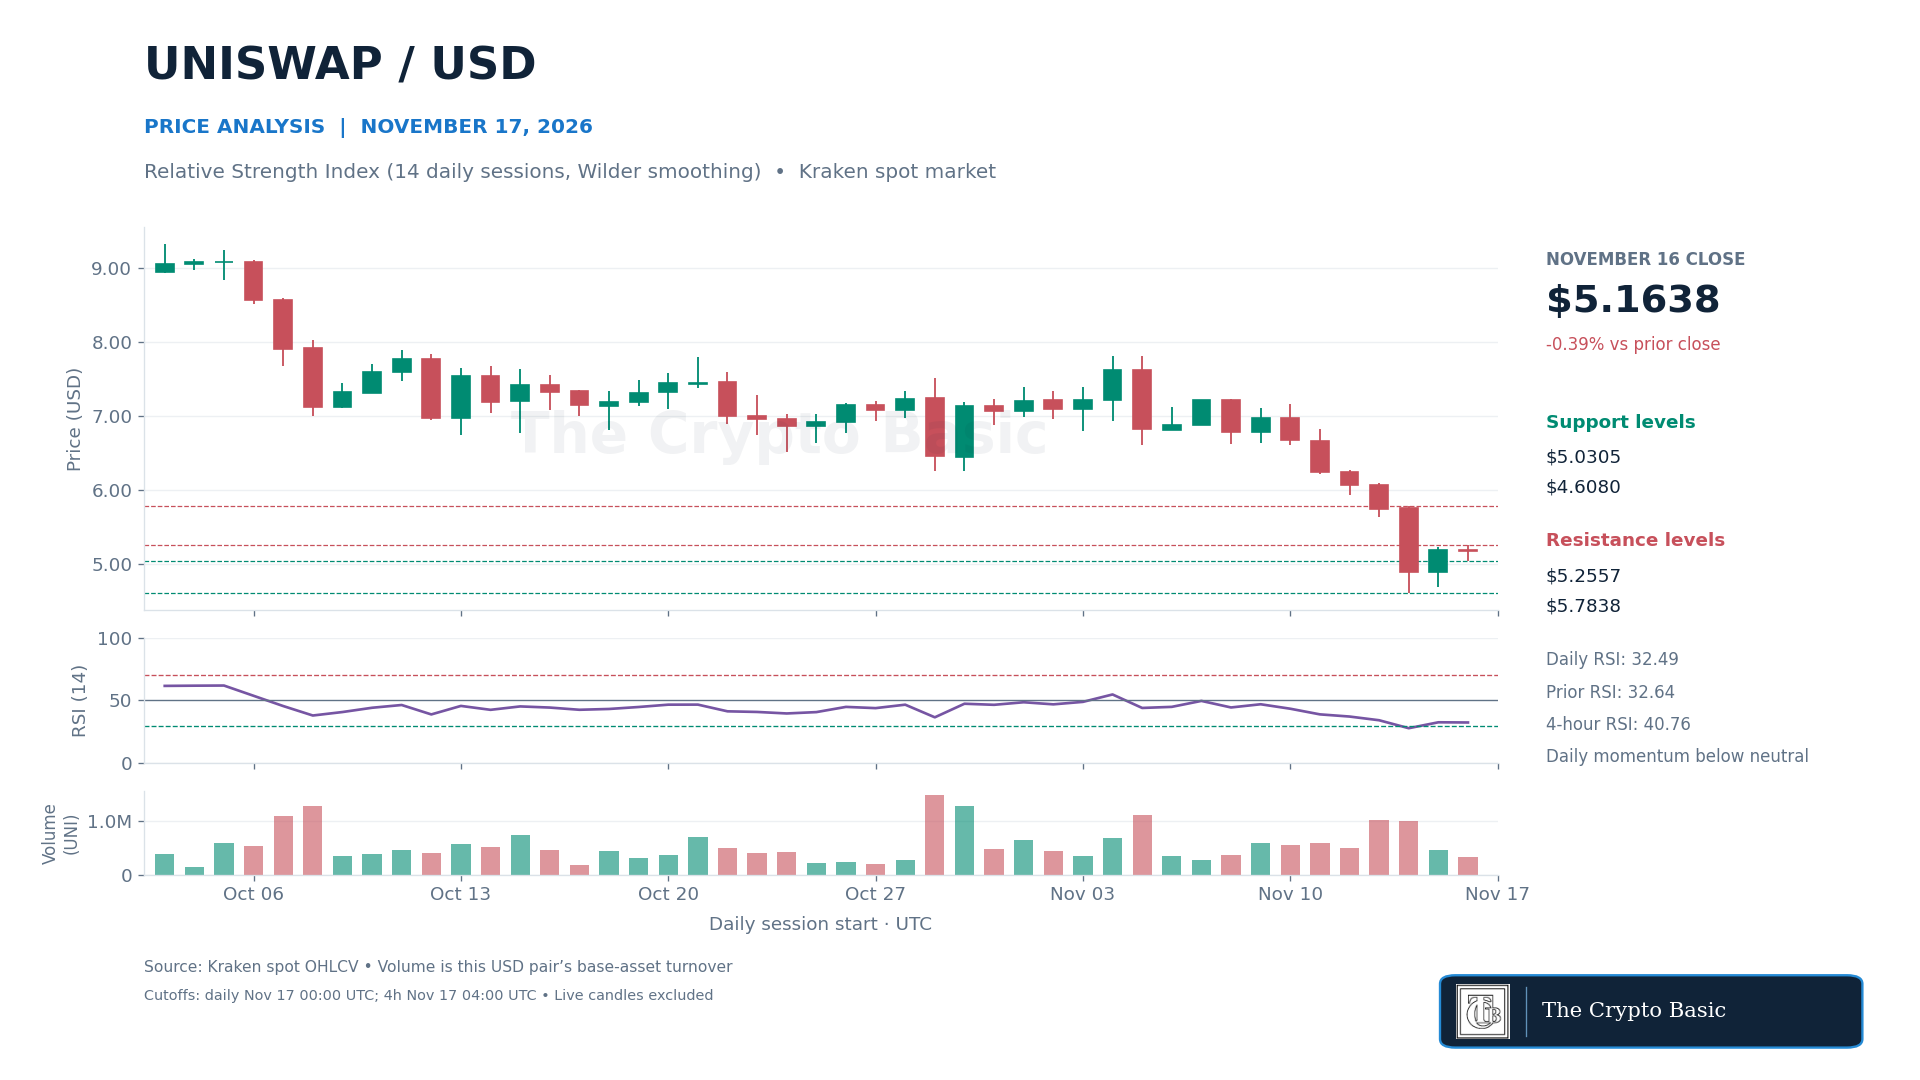
The 14-day Relative Strength Index, calculated with Wilder smoothing, edged down to 32.49 from 32.64. Momentum therefore remained close to the conventional oversold threshold of 30 without crossing it. The reading does not confirm a reversal; it shows that losses still dominate the lookback period.
Four-hour RSI was firmer at 40.76 as the latest completed candle closed at $5.2679. That shorter-term improvement needs a daily close above $5.2557 to confirm the first recovery step. A subsequent close above $5.7838 would break the November 14 high and weaken the immediate downtrend.
A close below $5.0305 would put $4.608 back in focus. Losing $4.608 would invalidate the stabilization and confirm another lower low.
Hyperliquid rebounds but stays below falling daily averages
Hyperliquid rose 2.36% on Monday to close at $69.74 after trading from $64.75 to $70.99. Its latest price was 2.44% below the $72.03 recorded in the November 11 HYPE analysis , despite a 5.75% gain over the past 24 hours.
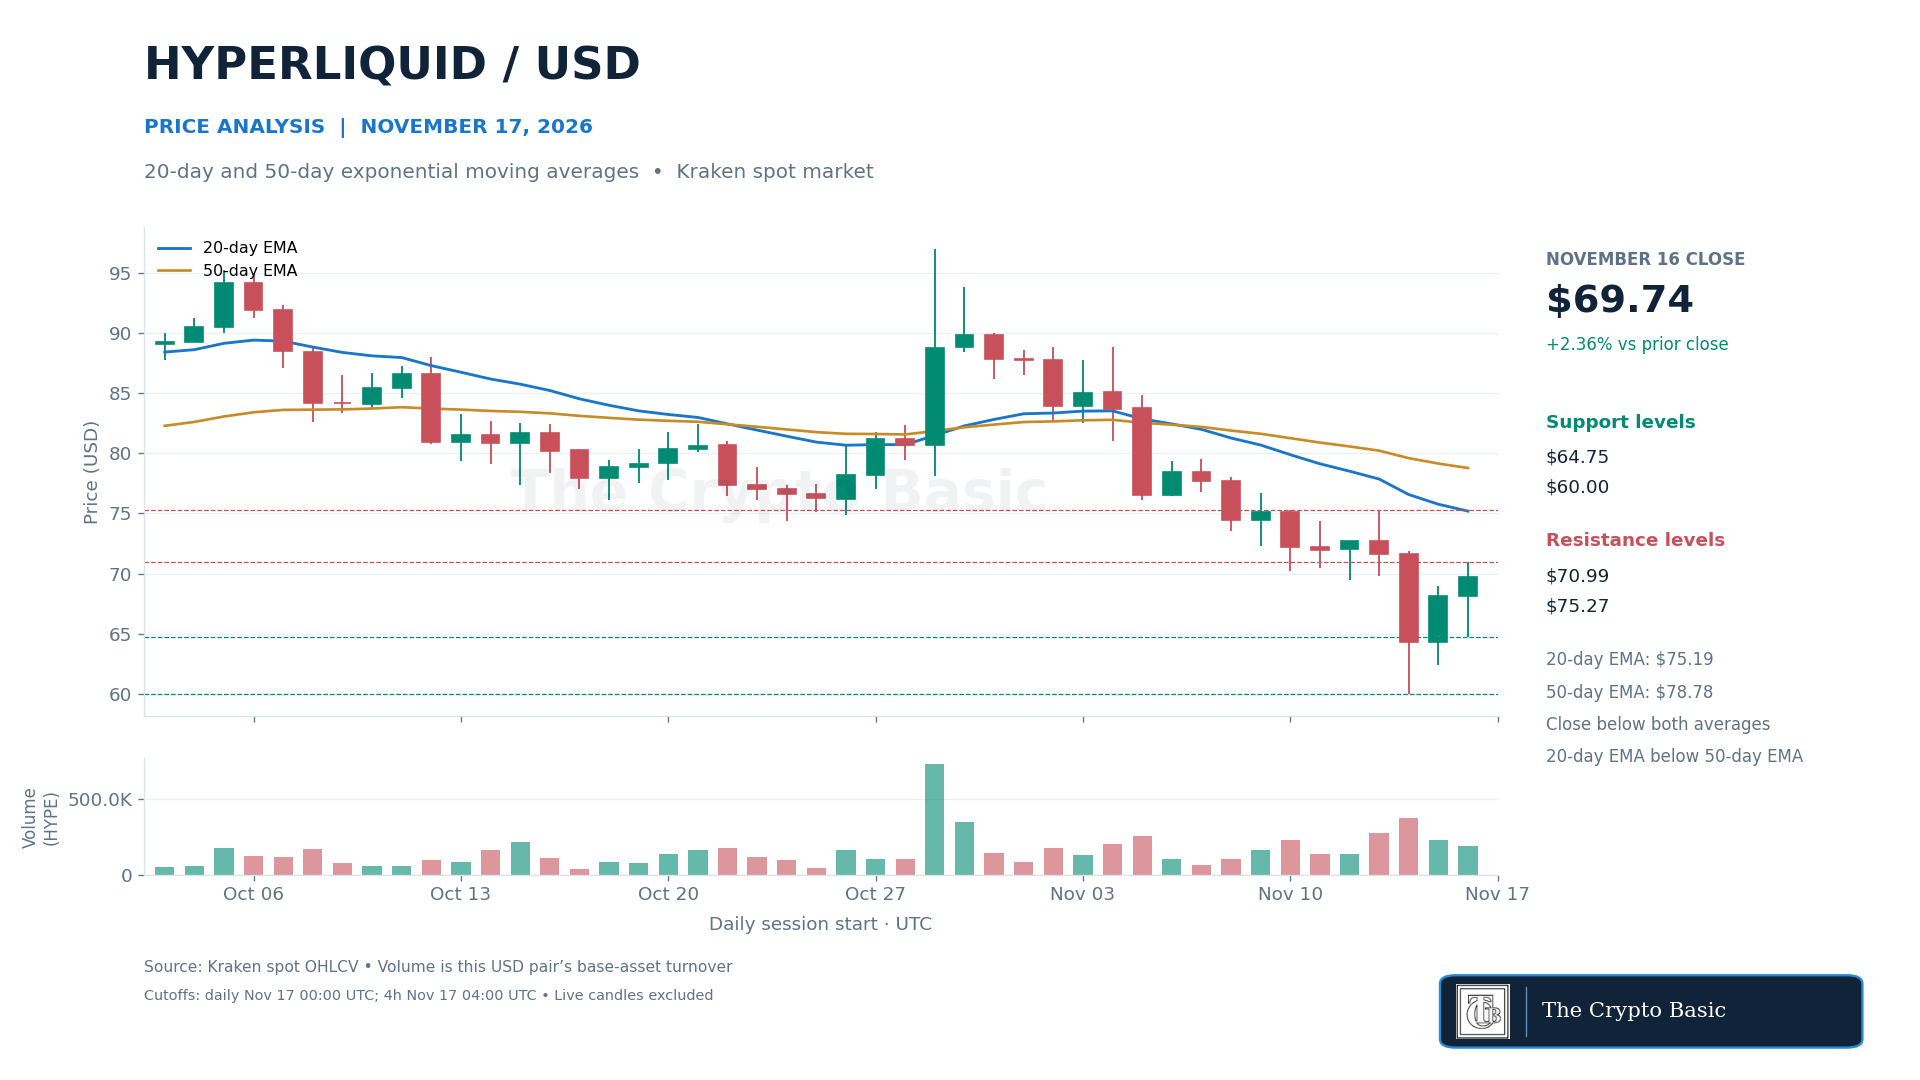
The 20-day exponential moving average declined to $75.19, while the 50-day EMA fell to $78.78. Price remained below both averages, and the faster average stayed below the slower one. Monday’s advance therefore extended a rebound from the November 14 low without changing the bearish daily alignment.
The four-hour chart showed more progress. The completed candle closed at $70.25, above its 20-period EMA at $68.38 but below the 50-period EMA at $70.94. A daily close above $70.99 would clear Monday’s high, with $75.27 and the daily 20-day EMA forming the next recovery tests.
A close below $64.75 would weaken the rebound. Losing $60 would invalidate it and confirm another downside break.
Venice Token recovers more than 61.8% of its latest downswing
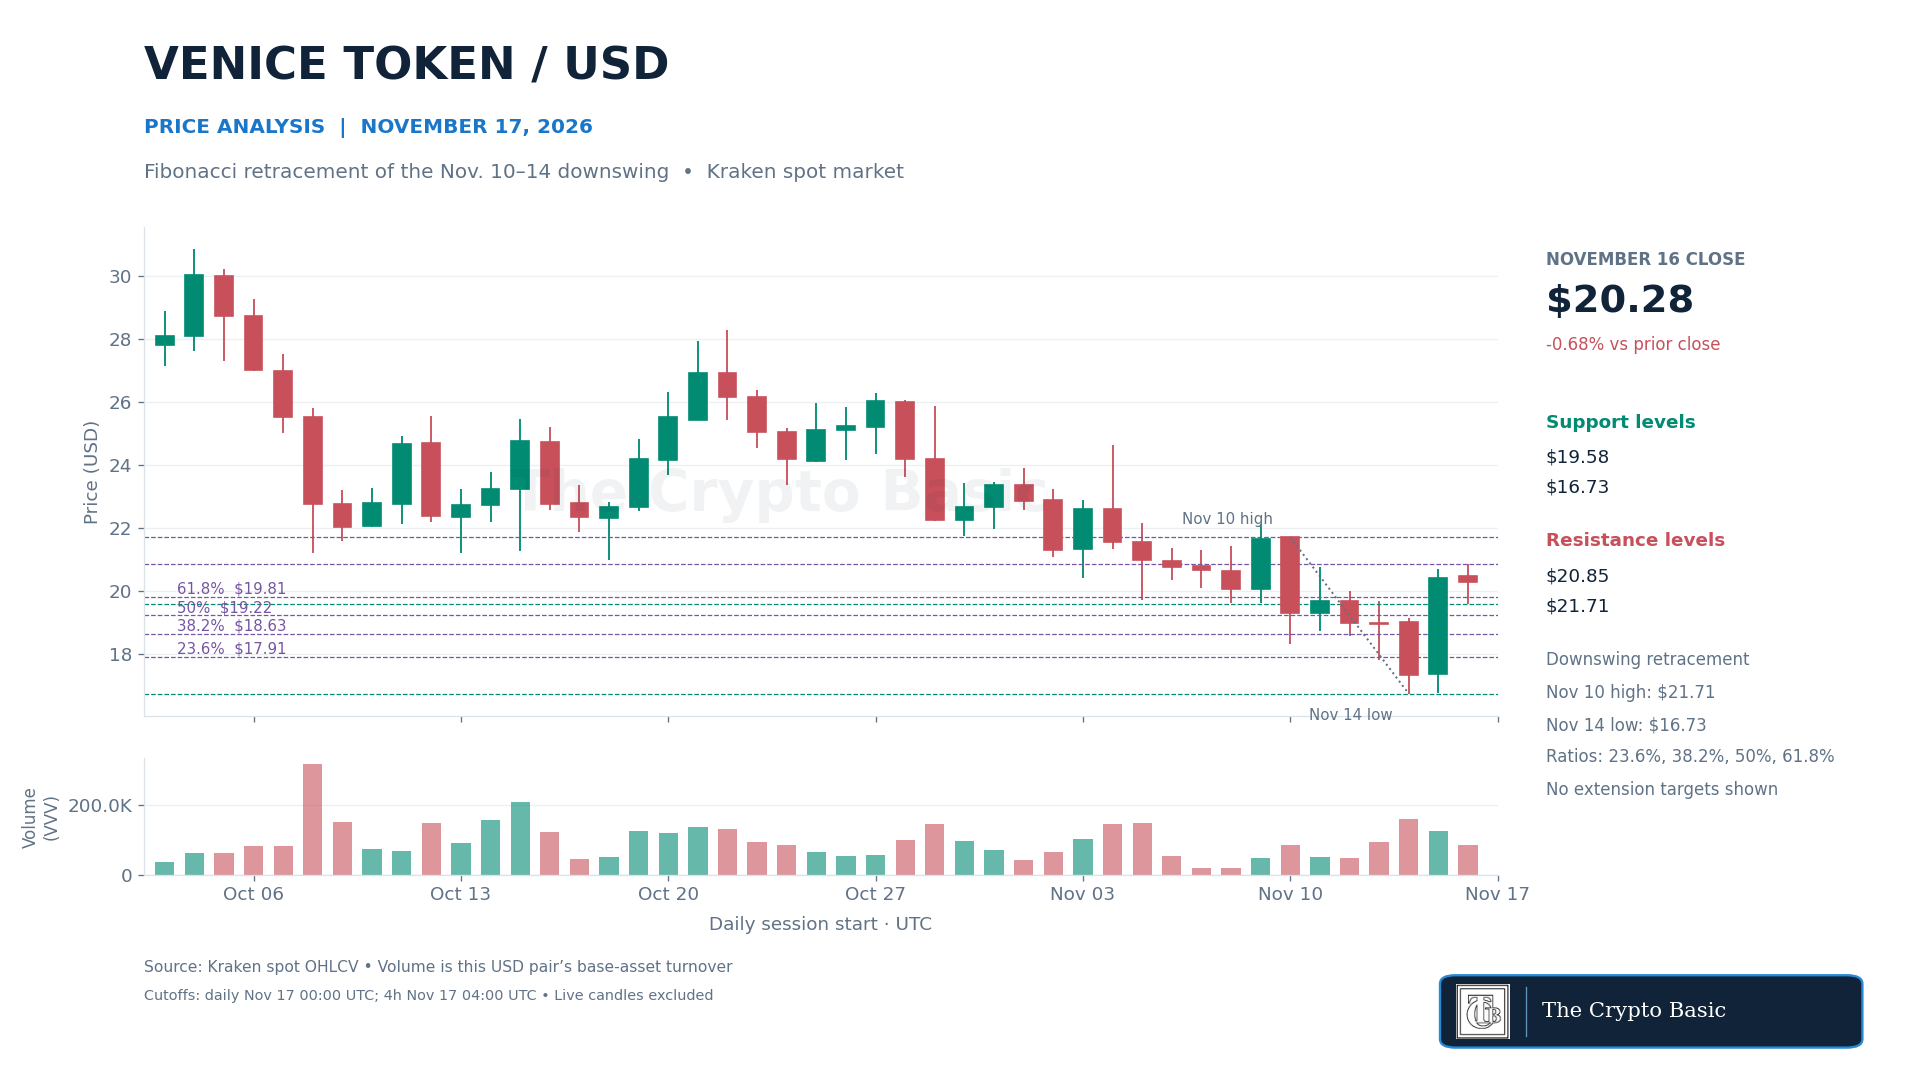
Venice Token closed Monday at $20.283, down 0.68%, after trading between $19.583 and $20.854. The latest price was 6.97% above the $19.81 recorded in the November 12 VVV analysis .
VVV was also up 5.69% over the past 24 hours. The difference from Monday’s completed decline reflects the later start and end points of the 24-hour window.
Fibonacci levels measure the recovery of the downswing from the November 10 high at $21.706 to the November 14 low at $16.735. The 23.6% retracement stands at $17.908, followed by 38.2% at $18.634, the midpoint at $19.221 and 61.8% at $19.807. Monday closed above the 61.8% level, recovering most of that decline without completing a return to the anchor high.
The latest completed four-hour candle closed at $21.168 after reaching $21.26. This cleared Monday’s high on the shorter timeframe, but the current daily candle remains open. A daily close above $21.706 would complete the retracement and confirm the stronger breakout.
A return below $19.807 would weaken the recovery, with $19.221 as the next support. A close below $16.735 would invalidate the retracement setup and confirm a new downside extension.