


A $1,000 position in each of the five largest non-stablecoin cryptocurrencies, opened on 8 November, would look very different this Sunday morning. The Bitcoin position would be worth about $850. The Ether position would hold $804, the Solana position $793 and the Hyperliquid position $850. The Tron position would still be worth $959, because Tron has spent the week refusing to fall with everything else.
That 166-dollar spread between the best and worst of five large-cap positions is the clearest thing this market has told anyone in seven days. It is also the reason the phrase “best crypto to buy now” has an answer most portfolios are not positioned for. Bitcoin trades at $64,445, down 14.84% on the week and 48.9% below its October 2025 record, according to CoinGecko’s spot data . Ether is at $1,791.85, Solana at $70.45. When five names this large diverge by 16 percentage points in seven days, the index stops describing the market. It averages five different ones.
The split is older than the week. Over twelve months Hyperliquid has returned 70.72% while Solana has lost 50.21%. That is a 121-point gap between two tokens that both trade, both run live perpetual markets and both sit inside the top 15 by market capitalisation. It is not a rounding error or a liquidity artefact. It is what a difference in product traction looks like once a year of price action has been allowed to settle.
What $1,000 Buys at 06:59 UTC
The table below is a point-in-time snapshot taken at 06:59 UTC on 15 November 2026. Every figure comes from CoinGecko’s market endpoint, and the twelve-month column compares price today with price one year ago rather than with the cycle high, which is where most drawdown tables stop and most readers give up.
| Asset | Price | 24 hours | 7 days | 30 days | 12 months | Market cap | From all-time high |
|---|---|---|---|---|---|---|---|
| Bitcoin (BTC) | $64,445 | -4.31% | -14.84% | -21.38% | -32.81% | $1.30 trillion | -48.9% |
| Ether (ETH) | $1,791.85 | -5.90% | -19.29% | -26.22% | -43.14% | $219.0 billion | -63.8% |
| Solana (SOL) | $70.45 | -6.89% | -20.38% | -32.94% | -50.21% | $41.7 billion | -76.0% |
| Tron (TRX) | $0.3072 | -1.78% | -4.04% | -8.21% | +4.46% | $29.2 billion | -28.8% |
| Hyperliquid (HYPE) | $65.54 | -5.93% | -14.82% | -19.09% | +70.72% | $15.6 billion | -33.1% |
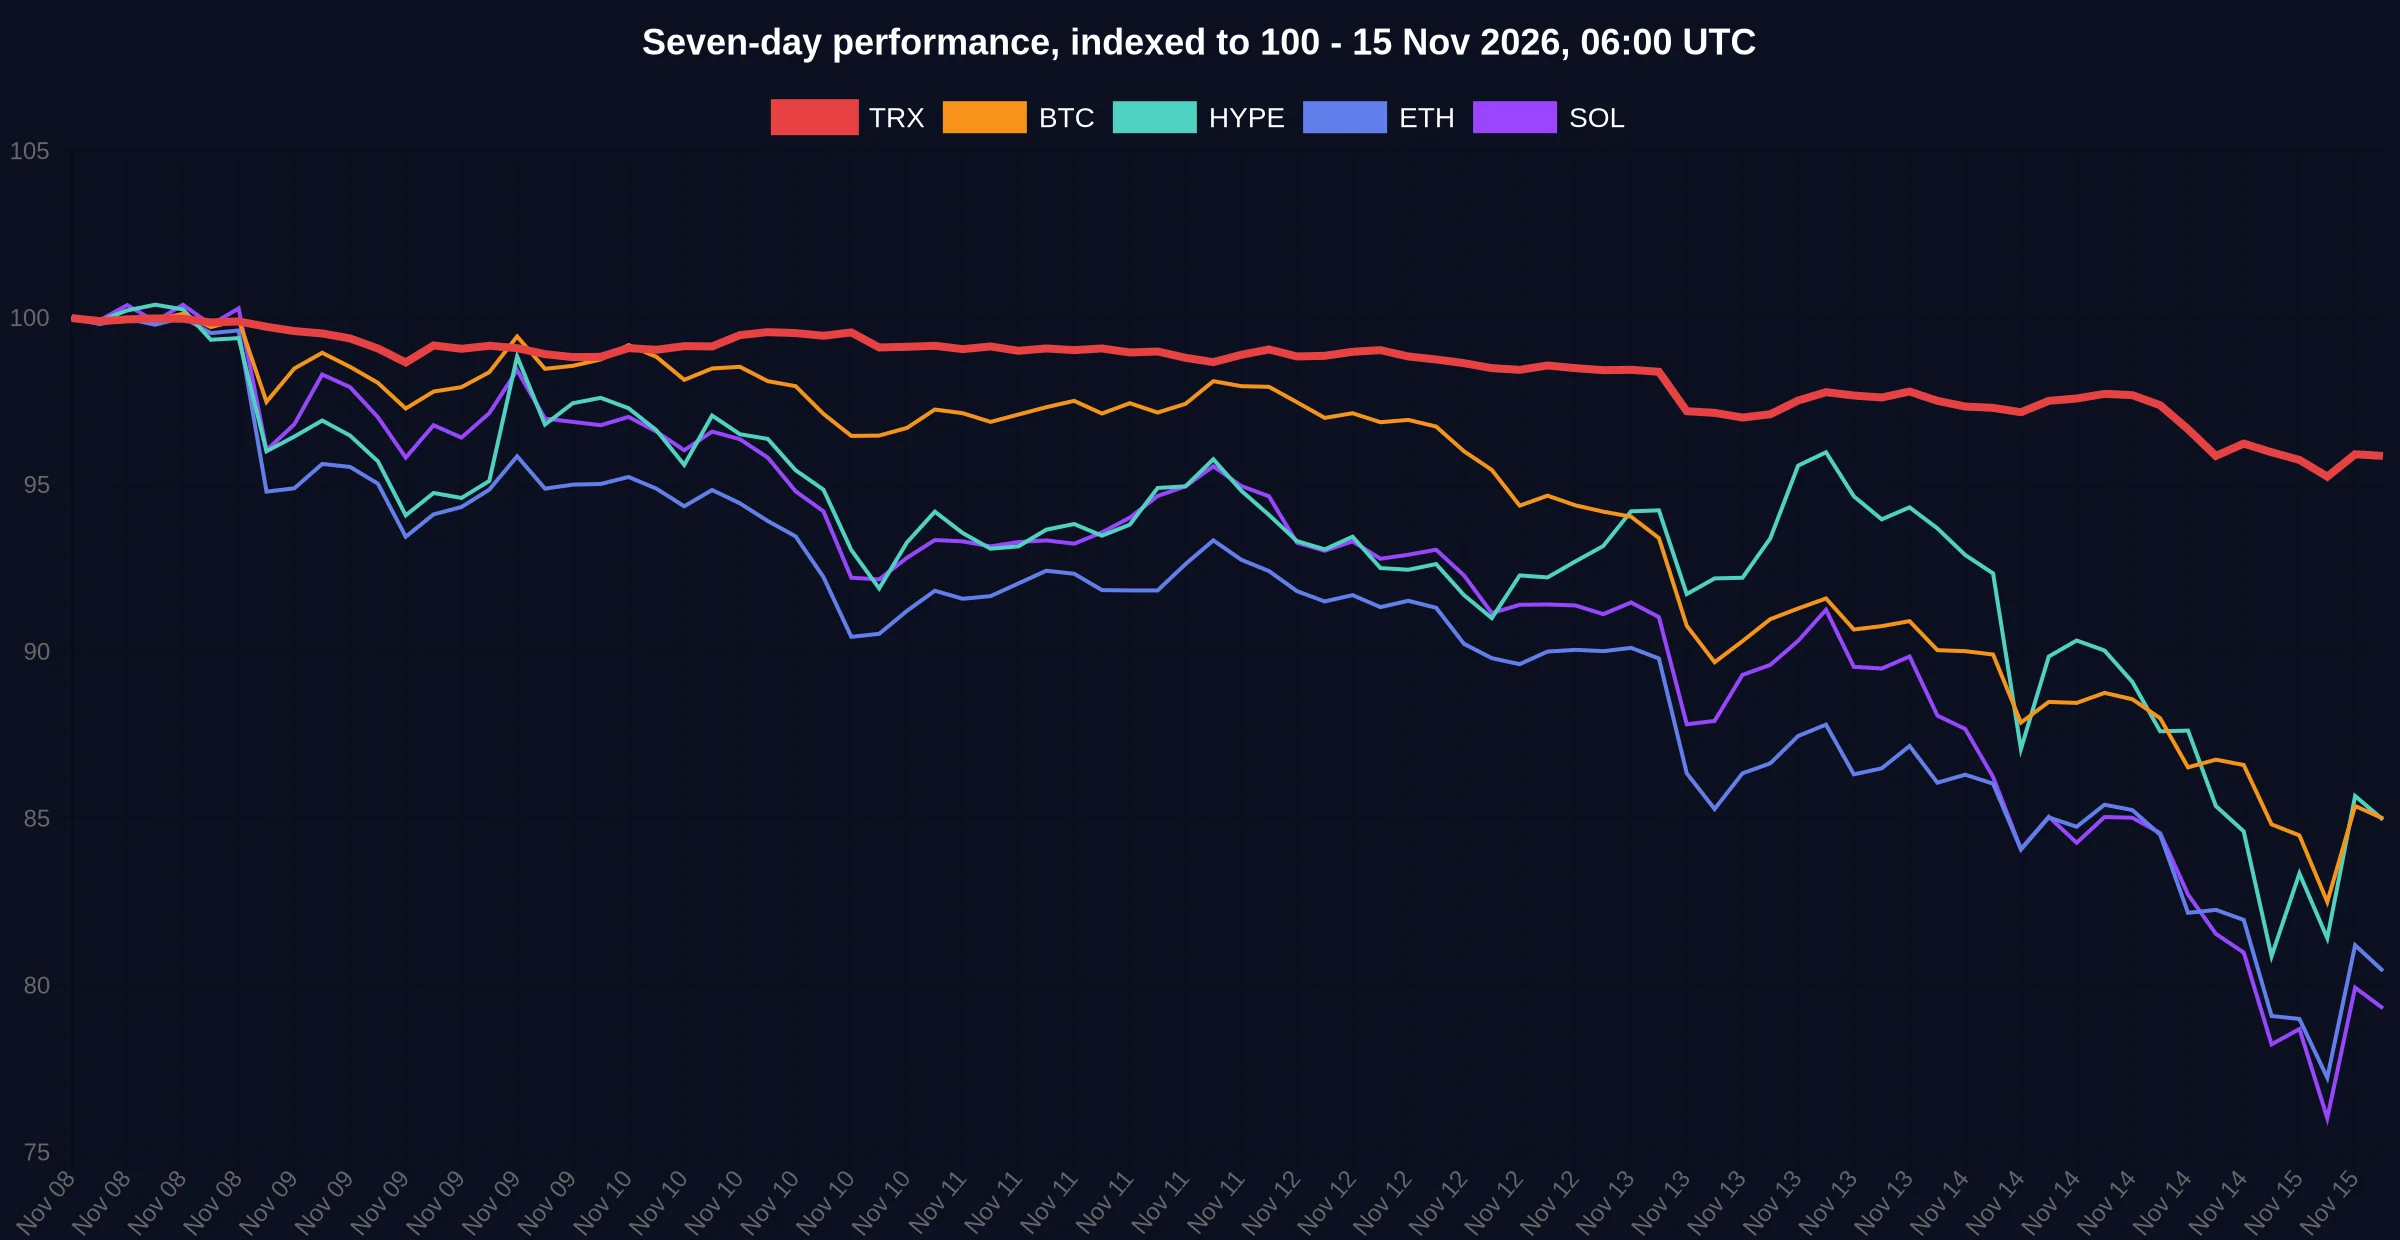
Read the fourth column and the fifth together. Every asset is down more over 30 days than over seven, which means this week accelerated a decline that was already running rather than starting a new one. Solana’s 30-day loss of 32.94% is more than 12 points worse than its weekly loss. Ether’s is seven points worse, and Bitcoin’s 6.5 points worse. The market did not break on Thursday or Friday. It has been leaking since the middle of October, and the last seven days made the leak impossible to ignore.
Data: CoinGecko , Binance Futures .
The 121-Point Gap Between Hyperliquid and Solana
Hyperliquid’s token launched in late 2024 and now carries a $15.6 billion market capitalisation. Solana was the defining large-cap trade of 2024 and 2025. The 121-point yearly spread between them is larger than the gap between Bitcoin and Ether, and larger than the gap between Ether and Solana.
The dollar arithmetic behind a recovery explains why the market treats these two tokens so differently. Hyperliquid’s market capitalisation of $15.6 billion would need to reach $31.2 billion to double, which at today’s circulating supply of 237.7 million tokens implies a price near $131. Its all-time high of $97.96, set on 23 September 2026, is 33.1% above the current price and would require a market capitalisation of roughly $23.3 billion. Solana would need $83.3 billion to double from $41.7 billion, and its January 2025 record of $293.31 sits 316% above the current price, which implies a market capitalisation near $173 billion. One of those numbers is a large-cap trade. The other is a bet that an entire ecosystem’s usage returns to a level it has not seen in 22 months.
None of that makes Hyperliquid cheap. It is the only asset in this table trading within 6% of its 200-day average, which describes trend strength rather than value. A token that has held its average through a 15% weekly decline is one the market is still willing to own, and that willingness can reverse inside a single funding cycle.
Tron’s 4% Week Is the Outlier Nobody Is Trading
Tron lost 4.04% over seven days while Bitcoin lost 14.84%. The 10.8-point spread is the largest relative outperformance among the five assets here, and it comes with the smallest derivatives footprint of any of them: Binance’s USDⓈ-margined TRX perpetual held $68.6 million of open interest at 07:04 UTC, against $6.32 billion for Bitcoin and $4.16 billion for Ether. Tron’s entire perpetual book on the largest venue is roughly 1% the size of Bitcoin’s.
That thinness cuts both ways and should be stated plainly. The available evidence does not establish why TRX held while the rest fell. A market this small can move on flows that would be invisible in Bitcoin, and no single announcement this week accounts for the divergence.
What the data does establish is that TRX is 28.8% below its December 2024 high, the shallowest drawdown in the table, and up 4.46% over twelve months while every other large-cap here is down between 32% and 50%. It trades 7.78% below its 200-day average of $0.3328, the second-smallest distance in the group, and its 30-day loss of 8.21% is a quarter of Solana’s. That is what a defensive position looks like in a market where the aggressive ones are down a third in a month. It is not a guarantee that the defence holds.
Funding Is Positive Where the Price Fell Fastest
Perpetual funding is the closest thing crypto has to a positioning census, and this week’s census is strange. At 07:04 UTC, Binance’s BTCUSDT perpetual carried a funding rate of 0.004264% per eight hours, which annualises to 4.67% for longs. ETHUSDT was at 0.003741%, or 4.10% annualised. HYPEUSDT was at 0.005%, or 5.47% annualised. All three are positive, which means leveraged longs are paying to stay long while the price falls.
The two assets that held up carry the opposite sign. SOLUSDT funding was -0.000262%, an annualised -0.29%, and TRXUSDT was -0.01799%, or -19.70% annualised. Tron’s rate is the most negative in the group by a wide margin: short positions are paying longs roughly 20% a year for the privilege of being short the one major that has not broken.
Open interest tells the same story from another angle. Measured against market capitalisation, Binance’s HYPE perpetual represents 2.29% of the token’s value, Ether 1.90%, Solana 1.55%, Bitcoin 0.49% and Tron 0.24%. The market is most leveraged where the product story is strongest and least leveraged where the price has been steadiest. That is a description of conviction, not a forecast, and conviction is what gets unwound first when a stop-loss cascade starts.
The Lines That Would Mark a Trend Change
The 200-day average is the boring test that most of this market has already failed, as Bitcoin’s break below it two days ago showed. Every level below is calculated by BlockchainReporter from 200 daily closes on CoinGecko and is stated with its basis so a reader can check it rather than trust it. Bitcoin’s average is $72,925, which puts spot 11.82% below trend. Ether’s is $2,142.53, with spot 16.58% below. Solana’s is $88.78, with spot 20.89% below. Tron’s is $0.3328, with spot 7.78% below. Hyperliquid’s is $69.17, with spot 5.67% below.
A reclaim of those averages is the first objective test of whether this decline has ended, and none of the five is close to it. The invalidation is symmetrical: a weekly close below this week’s low in any of these names would confirm that the trend still runs downhill and that the 30-day columns are the ones that matter. Between those two markers there is no level that means anything except to the people who drew it.
Two cross-checks measure the same thing from outside the price chart. The first is whether spot ETF flows stop bleeding: consecutive sessions of redemptions in Bitcoin funds preceded this week’s break, and a single inflow day would be the first evidence that the marginal buyer has returned. The second is whether the stablecoin float starts expanding again. Stablecoin supply shrinking while prices fall is a liquidity signal rather than a sentiment one, and the last money-angle read on this market flagged record-pace contraction a day before this week’s break.
What Would Make This Week’s Numbers Wrong
The case against buying anything right now rests on three observations this table supports. First, funding is positive on the three assets that fell hardest, which means the crowd is still long and has not capitulated; markets rarely bottom while the majority is paying to stay positioned. Second, none of these declines has produced the volume signature of a forced flush, and the 30-day columns suggest orderly selling rather than liquidation. Third, Tron’s strength is the kind of divergence that appears in the middle of a decline rather than at the end of one, because money rotating into a defensive name has not left the asset class.
The case for stabilisation is equally concrete. Bitcoin at $64,445 is 48.9% below its record, Ether 63.8% below and Solana 76% below. Drawdowns of that size have historically compressed forward returns into a narrower range than the headlines imply, and the tokens with the smallest drawdowns have been the ones with a working product attached. That is not a prediction. It is the only pattern the twelve-month column makes visible.
The honest conclusion for anyone holding cash and asking what to buy is that this week separated the assets rather than the asset class. A portfolio that treated BTC, ETH and SOL as one trade has now paid for that assumption twice: once in the drawdown and once in the opportunity cost of ignoring the two names that held. What happens next depends on flows that will show up in the data before they show up in the price.
Frequently Asked Questions
There is no single answer, and this week’s data shows why. Over seven days to 15 November 2026, Tron fell 4.04% while Bitcoin fell 14.84%, Ether 19.29%, Solana 20.38% and Hyperliquid 14.82%, per CoinGecko. The dispersion between the best and worst large-cap position was about 16 percentage points, so the choice of asset mattered more than the decision to be in the market at all.
The available evidence does not establish a cause. Tron’s relative strength coincided with the thinnest derivatives book of any major: Binance’s TRX perpetual held $68.6 million of open interest against $6.32 billion for Bitcoin. A market that small can move on flows that would be invisible in Bitcoin, and no single announcement this week accounts for the divergence.
Solana is the weakest of the five largest non-stablecoin assets, trading 76.0% below its January 2025 record of $293.31 and down 50.21% over twelve months. Ether is 63.8% below its all-time high, Bitcoin 48.9%, Hyperliquid 33.1% and Tron 28.8%, according to CoinGecko.
No. Negative funding means short positions are paying longs, which reflects positioning rather than direction. TRXUSDT carried a funding rate of -0.01799% per eight hours at 07:04 UTC on 15 November, an annualised -19.70%, while Bitcoin’s funding stayed positive at 0.004264% as its price fell. Funding describes who is paying to hold a position, not where the price goes next.
Prices, funding rates and open interest are point-in-time snapshots taken at 06:59 UTC and 07:04 UTC on 15 November 2026 and will change. Drawdowns, 200-day averages, twelve-month returns, market-cap arithmetic and annualised funding rates are calculated by BlockchainReporter from the CoinGecko and Binance data cited above.
Disclosure: This article does not represent investment advice. The content and materials featured on this page are for educational purposes only. Market data is a point-in-time snapshot and may change after publication.