




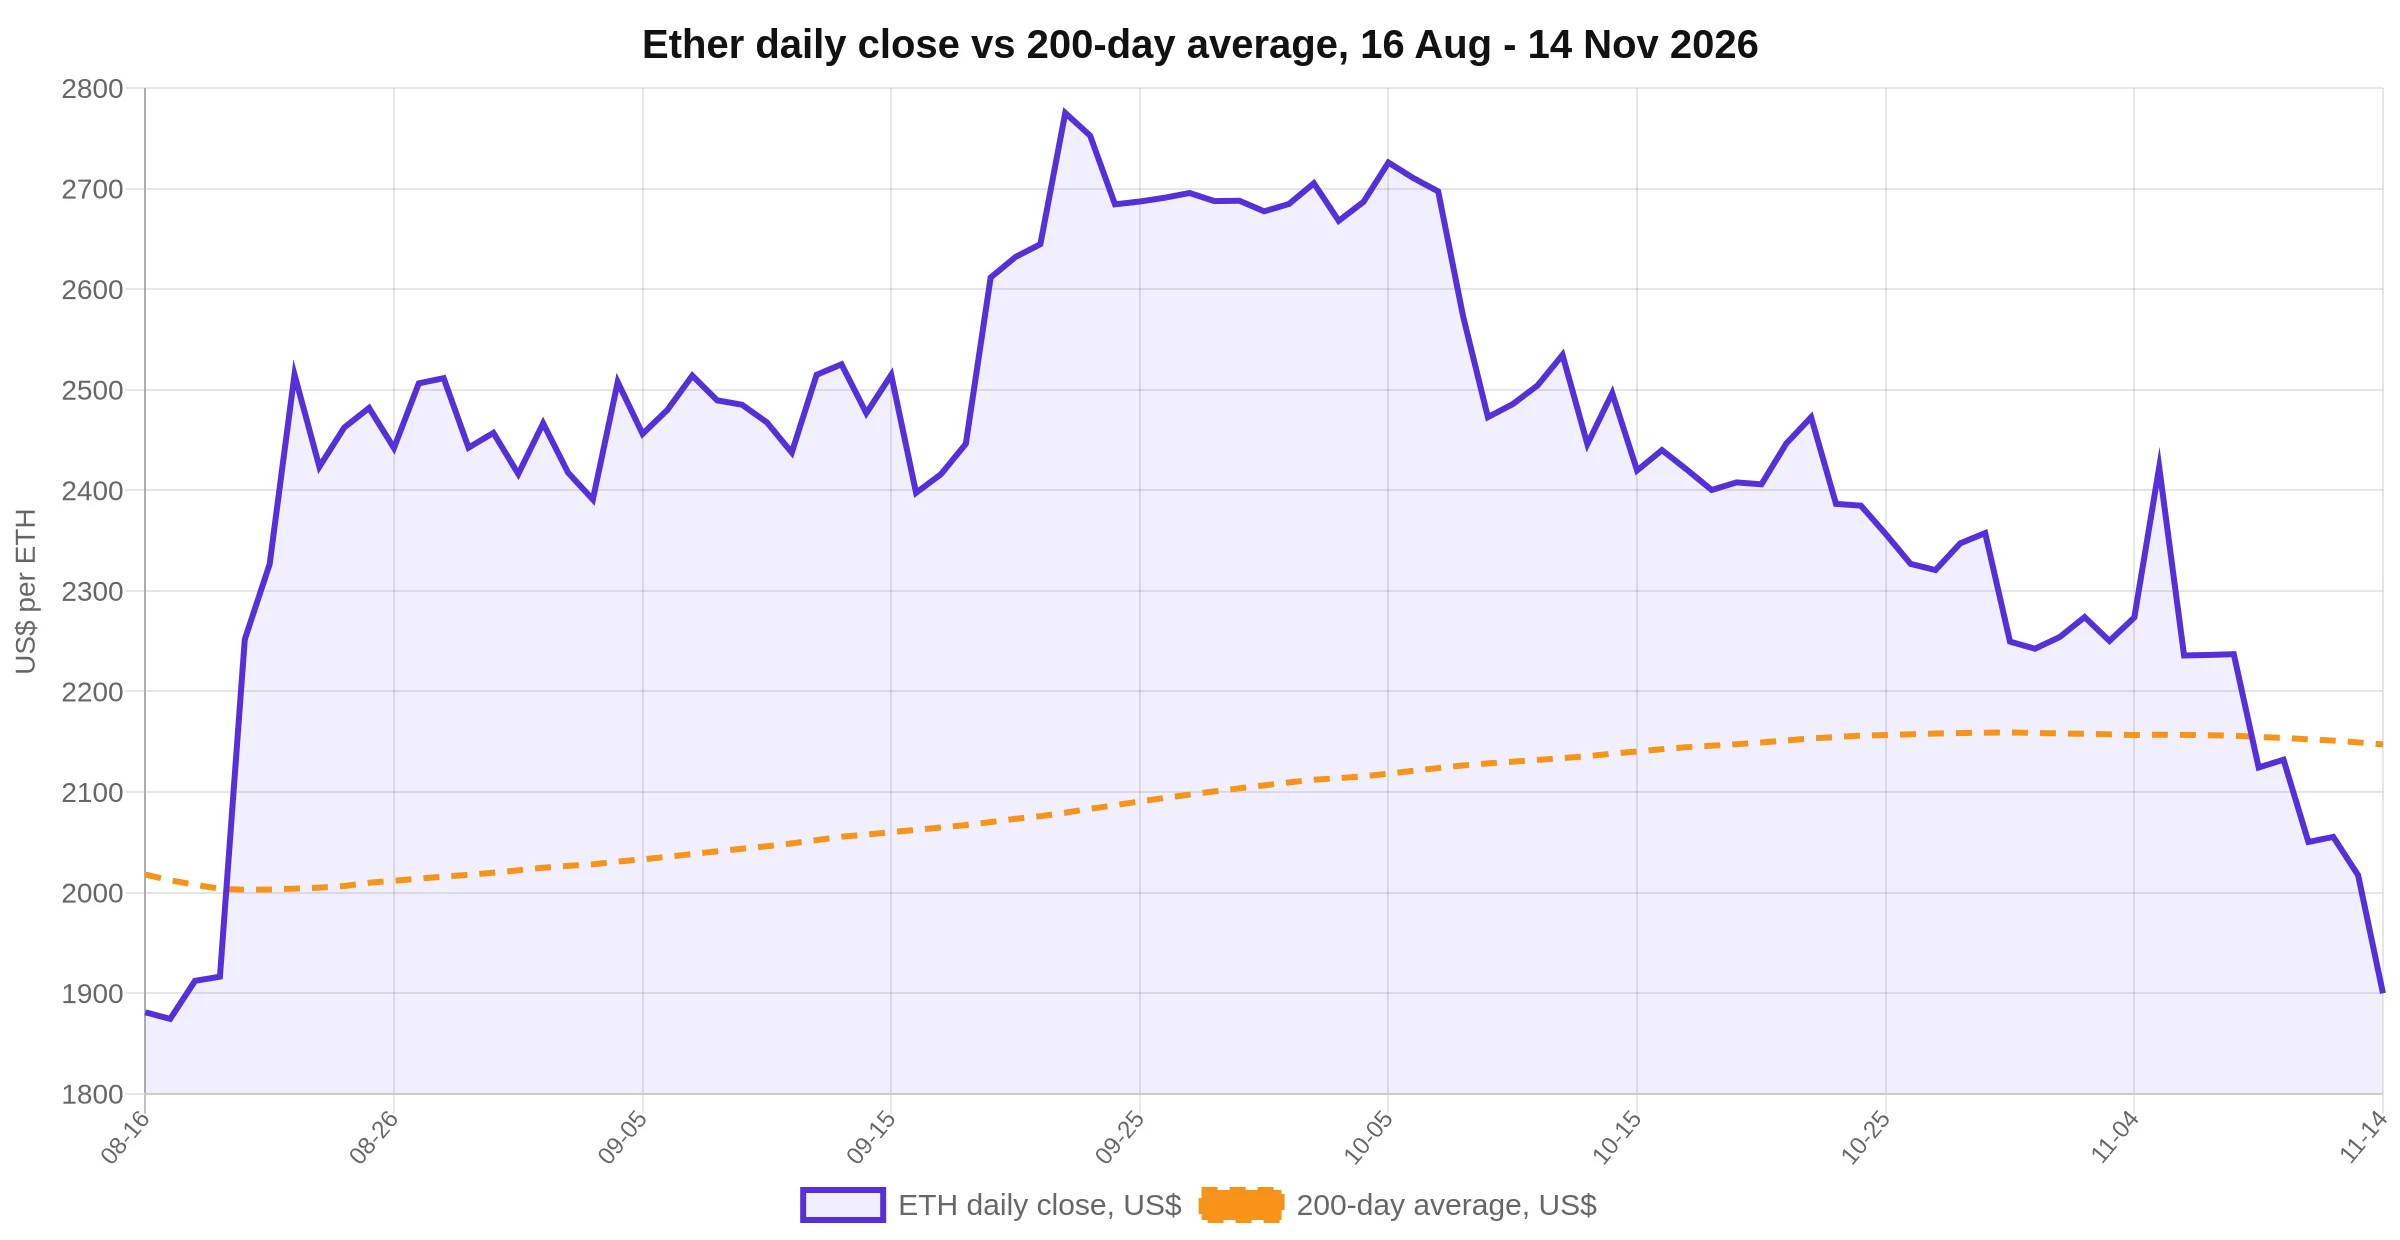
Ether traded at $1,901.11 at 05:29 UTC on Saturday, the first print below $2,000 since Aug. 19 and 43.3% beneath its Jan. 15 high of $3,351.82. The easy explanation is that Ethereum is being abandoned. The cross-section does not support it: over 30 days ether has fallen less than Solana and less than XRP, and on Saturday it fell less than bitcoin.
What the numbers do support is a repricing of time. The 10-year Treasury yield closed at 5.15% on Nov. 13, up 27 basis points across the four published sessions since Nov. 9, and spot bitcoin funds shed $1.065 billion over five settlement days. Ether lost a round number inside that move. The question this article weighs is which of those facts explains the others.
Over the same week, spot bitcoin funds ran five negative sessions totalling .0653 billion and spot ether funds ran six totalling 4.4 million before a .3 million inflow on Nov. 13. ETH/BTC sat at 0.02833, down 4.47% from the 0.02965 printed on Oct. 15.
| Asset | Price, 05:29 UTC | 24h | 30 days | Market cap | From 2026 high |
|---|---|---|---|---|---|
| BTC | $67,112 | -2.34% | -17.83% | $1.350 trillion | -30.8% |
| ETH | $1,901.11 | -1.17% | -21.48% | $232.4 billion | -43.3% |
| SOL | $75.55 | -4.06% | -27.45% | $44.7 billion | -48.4% |
| XRP | $0.9954 | -1.80% | -25.14% | $63.3 billion | -57.68% |
The Fed’s October record is the document behind the repricing
The written record that frames this week’s move in rates is the Federal Open Market Committee’s statement of Oct. 28 , published by a 10 to 2 vote. It contains no reference to digital assets. What it contains is a policy stance and two dissents pointing the same way.
“The Committee decided to maintain the target range for the federal funds rate at 3-3/4 to 4 percent, in support of the Federal Reserve’s dual mandate.”
“Inflation remains elevated. The accumulation of more information will help the Committee determine the policy stance appropriate to ensure a timely return of inflation to the Committee’s 2 percent goal.”
“Voting against the monetary policy action were Lisa D. Cook and Beth M. Hammack, who preferred to raise the target range for the federal funds rate by 1/4 percentage point at this meeting.”
Read the last sentence twice. The dissents were for a quarter-point increase, not for a cut. A committee that holds at 3.75% to 4% while two voting members argue for higher rates sets a different backdrop for an asset with no cash flow than a committee debating the pace of easing, and the Treasury’s own par curve shows where the repricing landed. The two-year yield, the maturity most sensitive to the expected policy path, went from 4.56% on Nov. 9 to 4.88% on Nov. 13, a 32-basis-point move. The 10-year went from 4.88% to 5.15%, 27 basis points. The 30-year went from 5.26% to 5.47%.
Two limits belong on that comparison. The statement is 17 days old, so it cannot account for a four-session move on its own, and the Treasury file records yields without explaining them. The available evidence establishes that long-end yields rose and crypto prices fell over the same window. It does not establish which caused which. A repricing of that speed usually reflects several inputs at once, and this article does not claim to have isolated them.
Five sessions out of bitcoin funds, six out of ether’s
Flow data is cleaner than the macro story, because it counts something. Farside Investors publishes daily net creations and redemptions for the US spot funds, and the ether row was negative for six consecutive settlement days before Friday’s print.
| Session | Spot BTC funds, US$m | Spot ETH funds, US$m |
|---|---|---|
| Nov. 5 | -430.2 | -99.9 |
| Nov. 6 | -411.9 | -93.3 |
| Nov. 9 | -201.0 | -184.6 |
| Nov. 10 | -95.0 | -1.3 |
| Nov. 11 | -299.8 | -144.8 |
| Nov. 12 | -284.1 | -70.5 |
| Nov. 13 | -185.4 | +2.3 |
| Five-session total, Nov. 9-13 | -1,065.3 | -398.9 |
The bitcoin row has not printed a positive session since Nov. 4, when it took in $74.6 million. Across the five sessions from Nov. 9 to Nov. 13 the funds lost $1.0653 billion, and IBIT alone accounted for $143.5 million of Friday’s $185.4 million exit, extending the pattern that made it the largest single contributor to the $2.1 billion ETF exit reported on Nov. 10 . The ether funds lost $594.4 million across their six negative sessions from Nov. 5 to Nov. 12, then took in $2.3 million on Nov. 13, with BITB adding $11.6 million against a $9.3 million redemption in GBTC.
Two calculations put those flows in proportion. The $1.0653 billion that left bitcoin funds over five sessions equals 0.079% of bitcoin’s $1.350 trillion market cap, which is a rounding error against the asset’s size and a large number against a trading week. The ether funds have absorbed $11.552 billion in net creations since launch, against $54.701 billion for the bitcoin funds. Measured against each asset’s market cap, that is 4.97% for ether and 4.05% for bitcoin. The comparison is between net creations and market value, not between assets under management and market value, because Farside’s totals count creations and redemptions rather than the funds’ holdings. Read that way, ether’s wrappers have taken in more, relative to the size of the asset, than bitcoin’s have.
One timing caveat applies to all of it. Farside’s figures settle a day behind the tape, so Nov. 14’s flows are not in the table, and the Nov. 13 inflow of $2.3 million can be a creation by a single authorized participant rather than a change in demand. Flow data shows what the wrapper did, not what its holders intend.
The cross-section says this is not an Ethereum exit
Ether’s problem is not that it fell. Everything fell. The question is whether ether is the weak leg of the market, and there the picture splits depending on which comparison you run.
Against bitcoin it is weak on every window measured here. Ether is down 15.04% over seven days against 11.51% for bitcoin, 21.48% over 30 days against 17.83%, and 43.3% from its Jan. 15 high against 30.8% from bitcoin’s high the same day. That is a 3.65-percentage-point gap over 30 days and a 12.52-point gap from the January peak, both calculated from CoinGecko’s daily closes.
Against the rest of the large-cap market it is not. Solana is down 27.45% over 30 days and 48.4% from its January high. XRP is down 25.14% and 57.68%. Ether’s 21.48% sits between bitcoin and those two, which is what a market-wide de-risking looks like when the largest asset is the one being sold first. Capital is not rotating out of Ethereum into something else; from the price data, it is leaving the asset class, and ether’s round-number break is a milestone inside that exit rather than evidence about Ethereum’s usage, fee revenue or roadmap.
Where ether is genuinely weak: 0.0283 against bitcoin
The ETH/BTC ratio is the one place where ether carries a specific discount. It closed at 0.02833 on Saturday, down 4.47% from 0.02965 on Oct. 15, extending a slide that had already taken it to 0.0295 in the first week of November, when ether was still above $2,200 . It printed 0.02781 on Nov. 11, the lowest close of this stretch. The 365-day low is 0.02578, set on June 7.
That compression is the strongest argument that something ether-specific is happening, and it is also the weakest version of the argument that ether is broken. A ratio falling from 0.02965 to 0.02833 over a month is a 4.47% relative move, while both assets lost double digits in dollar terms. Ether is underperforming bitcoin at the margin, in a market where everything is falling.
The countercase is sitting in Friday’s tape
Three observations run against the bearish reading, and each is small enough to dismiss on its own.
First, ether outperformed on the day of the break. It fell 1.17% in 24 hours while bitcoin fell 2.34%, and the ratio ticked up from 0.02781 on Nov. 11 to 0.02833, which is not what a rotation out of ether looks like.
Second, the ether funds took in money on Nov. 13 while the bitcoin funds lost $185.4 million. If institutional holders were abandoning the asset, the wrapper they use to hold it would not have printed a positive session the same day.
Third, the size of that inflow is trivial. $2.3 million against $594.4 million of outflows over six sessions is 0.39%, a rounding error dressed as a turn. One session does not reverse a streak, and this article does not treat it as one.
The prices that would retire this read
Each level below carries its basis, and each is a daily close on CoinGecko’s UTC series unless stated otherwise.
,147.31 is the 200-day average, the mean of 200 daily closes; a close above it would retire the claim that ether trades below its ten-month average price, and it sits 12.95% above Saturday’s quote. ,413.60 is the 50-day average and the first level at which the short-term trend would stop pointing down. The Aug. 19 and Aug. 17 closes at ,916.40 and ,874.40 are where a closing loss extends the break into the August range, and ,566.01 is the June 26 close, the lowest of the past 365 days and 17.63% below Saturday’s quote.
On rates, 5.00% on the 10-year is the macro invalidation. The yield printed 4.98% on Nov. 10, and a return below that level would remove the rate pressure described here without proving it caused anything.
Those levels are checkpoints, not forecasts. A close above the 200-day average would not make ether expensive, and a close below the August range would not make it cheap. They are the prices at which the current read stops being true.
What publishes next
Three prints settle the argument faster than commentary. Farside’s Nov. 16 flow file will show whether Friday’s $2.3 million was a one-off creation or the start of a sequence, and whether the bitcoin funds broke their run of outflows. The Treasury’s Nov. 16 par curve will show whether the 10-year holds above 5%, the level on which the macro leg of this story rests. And ether’s weekly close will show whether the token ends the week above the Aug. 19 close of $1,916.40 or accepts the break.
Weigh the evidence and the conclusion is narrower than either camp wants. Ether lost a round number because the whole asset class lost value while the risk-free alternative paid 5.15%, and it carries an added discount against bitcoin that no single data point here explains. The break below $2,000 is real, the rate backdrop is documented, and the link between them remains correlation, not proof.
Frequently Asked Questions
Ether traded at $1,901.11 at 05:29 UTC on Nov. 14, its first print under $2,000 since Aug. 19. The move came in the same week that the 10-year Treasury yield rose to 5.15% from 4.88% and spot bitcoin funds lost $1.065 billion over five sessions. The available evidence shows the two moved together; it does not prove the yield rise caused the price decline.
Ether closed below $2,000 on Aug. 17 at $1,874.40, Aug. 18 at $1,912.27 and Aug. 19 at $1,916.40. Its last close above the line was Nov. 13 at $2,017.35.
Against bitcoin, yes: ether is down 21.48% over 30 days versus 17.83% for bitcoin. Against Solana and XRP it is not: those fell 27.45% and 25.14% over the same window, according to CoinGecko daily closes.
The US spot ether funds lost money for six consecutive sessions from Nov. 5 to Nov. 12, totalling $594.4 million, according to Farside Investors. On Nov. 13 they took in $2.3 million, with BITB adding $11.6 million and GBTC redeeming $9.3 million.
ETH/BTC stood at 0.02833 on Nov. 14, down 4.47% from 0.02965 on Oct. 15. It printed 0.02781 on Nov. 11, the lowest close of this stretch, against a 365-day low of 0.02578 on June 7.
A daily close above the 200-day average at $2,147.31 would retire the claim that ether trades below its ten-month average price. A close below the August range at $1,874.40 would extend the break. On the macro side, a 10-year yield back below 5.00% would remove the rate pressure described here.
Data: Farside Investors , U.S. Treasury , CoinGecko .
This article is not investment advice. Price and flow figures are as of the timestamps stated and change continuously.