




As we enter October, the price of Bitcoin will not fix the underlying structural problem.
The demand in Europe is outpacing that in the US. Liquidity is concentrated in Bitcoin, which is bad news for Ethereum.
Large accounts are leaning short on the rally. The use of flashing warning lights is also typical over the weekend.
With a gain of over 3% week-to-date and 8.8% month-to-date, Bitcoin was trading under $86,000 on Monday.
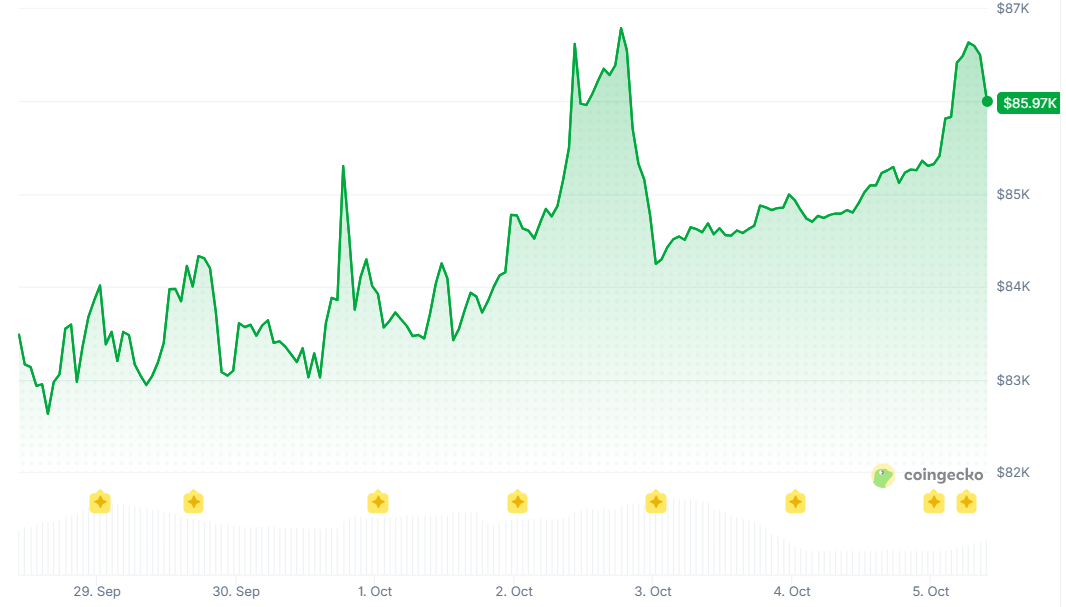
The headline number looks good, but the story goes deeper.
The Yield Trap
The US 10-year Treasury yield was the most important macro indicator this past week; it hit 5.34%, its highest level since April 2002, for a short while before falling back to around 5.25%.
The correlation between yields and cryptocurrency has grown into a pattern that is almost instinctual.
Bitcoin briefly surpassed $85,500 on Wednesday due to a PCE inflation report that was less than expected, but the gains soon faded as the 10-year yield stayed firmly over 5.3%.
Although the probability of a rate hike fell to 24.9% from 37.6% the day before, according to the CME FedWatch tool, this change was not enough to sustain a breakout.
Investing in riskier assets necessitates a higher return criterio n, as risk-free government debt yields 5.3%. The logic for this is obvious.
Inflows into exchange-traded funds hit a record high of $2.39 billion during the week of September 21–25, the highest weekly total in over a year.
On the other hand, this inflow was enough to keep prices stable, not rise.
The Sunday Pump, Monday Dump Pattern
Skilled Ali Charts have seen a pattern that has recently resurfaced.
If Bitcoin's price goes up on Sunday, it usually goes back down on Monday , and vice versa.
This trend has been repeated several times in the past month.
Coincident with the 1% gain in BTC on Sunday, October 4, TD Sequential sell signals showed up on the four-hour charts of Ethereum, Solana, and Bitcoin.
A correction has come in each of the last four instances of similar BTC indications.
This trend points to a systemic problem in the market : since exchange-traded funds (ETFs) may only trade during US trading hours, institutional purchasers aren't available on weekends to offset selling pressure.
The market was left with reduced activity heading into the weekend after spot ETFs drew $999 million on Monday, September 21, and then saw a decrease in inflows to below $150 million on Friday.
Shorts Are Bigger Than Longs
Big participants' placement in Hyperliquid provides perhaps the most illuminating indication.
A long-short ratio of 0.62 was seen as of October 5th, with around 200 active addresses holding assets over $3 million.
These addresses were involved in BTC short positions totaling $830 million, as opposed to $518 million in long holdings.
There was a ratio of 0.65 in the Ethereum market, meaning that short holdings hit $1.05 billion while long positions remained at $687 million.
This is in sharp contrast to the story told to individual investors about how institutions have adopted and how many ETFs have entered the market.
Big money sees the surge as vulnerable, which is a view that isn't reflected in the ETF flows.
Liquidity Vacuum
The most important Bitcoin liquidation zone, according to Glassnode , is located above the current price, at around $90,000.
Those who have leveraged short bets would be required to close them if the price were to rise to this level.
Clusters of smaller sizes are located between $75,000 and $83,000.
The on-chain analytics company warns that changes in momentum could make the next wave of volatility worse.
The $83,000–$87,000 range has been mostly unchanged for a few days, and the $87,000 mark represents the next immediate obstacle.
If the price stays above that level every day, it might reach $89,000 to $90,000, setting off a chain reaction of liquidations.
Europe Bids, America Fades
From a structural perspective, geographic bets stand out.
In contrast to the 3% fall in the American market since early September, demand for Bitcoin in Europe has climbed by 4%.
In the 29 days leading up to October 3, the Coinbase Premium Index - which compares the price of Bitcoin on Coinbase to that of other global platforms - had negative values ranging from -0.01% to -0.03%.
Bids from American buyers are lower than global market bids.
The spot demand parameter tracked by CryptoQuant showed a decline of almost 170,000 BTC in the 30 days before early October.
Less strong support than the price chart indicates may have supported the spike from $75,000 to $87,000.
This situation becomes more complicated due to the entrance of ETFs.
Investors who trade on exchanges are different from advisors and institutions who use brokerage accounts.
With a negative Coinbase premium and an ETF week worth $2.39 billion, it seems that demand in the US is more patchy than solid.
Conversely, infrastructural development is taking place in Europe.
If you want exposure to Bitcoin but want to hedge against currency volatility, HANetf has you covered with their first-ever euro-hedged Bitcoin exchange-traded commodity, which debuted on September 29.
A consensus is emerging among EU member states about the MiCA framework.
Ethereum's Liquidity Problem
Currently, Ethereum's median order-book depth across eight major exchanges is $13–14 million, which is just 35%–45% of Bitcoin's liquidity.
A year ago, ETH was trading at a premium to BTC, at around 60% of its value.
Nearly half the amount from 2025 is now in Bitcoin, with a median aggregate depth of $29 million on the bid side and $37 million on the ask side.
The ratio fell not because Ethereum was significantly worse off, but because Bitcoin improved while ETH did not.
Spot ETFs have encouraged more institutional investment in Bitcoin, which has improved the cryptocurrency's order book.
Similarly, investors have shown little enthusiasm for Ethereum's spot ETFs.
Wider spreads and more slippage during volatile periods are consequences of Ethereum's shorter order book, which has important ramifications for major market participants.
The market's tendency to mimic Bitcoin's price action means that reduced liquidity could worsen losses.
What to Watch
The immediate technical obstacle to closely monitor is the $87,000 cap on BTC.
Along with the short liquidation cluster found by Glassnode , the $89,000-$90,000 range is the target of a confirmed daily close above it.
With worsening macroeconomic conditions, $82,000 is once again being considered, with $75,000 acting as the stronger support level.
Smart investors are bracing for the preceding scenario, as shown by the whales' short positions.
According to data on ETF flows and demand in Europe, the latter is far from guaranteed.
The disparity in liquidity between Bitcoin and Ethereum is now a systemic phenomenon.
When market conditions are tough, ETH's execution quality deficit becomes even more pronounced unless it attracts the same amount of institutional order-book commitment.
Even though it's dispersed, Bitcoin's increase is real.
Funds are not evenly distributed, leverage is strategically coordinated, and they come from a variety of sources.
These factors can be momentarily obscured by value. In most cases, it doesn't happen indefinitely.
What Other Technical Readings Show
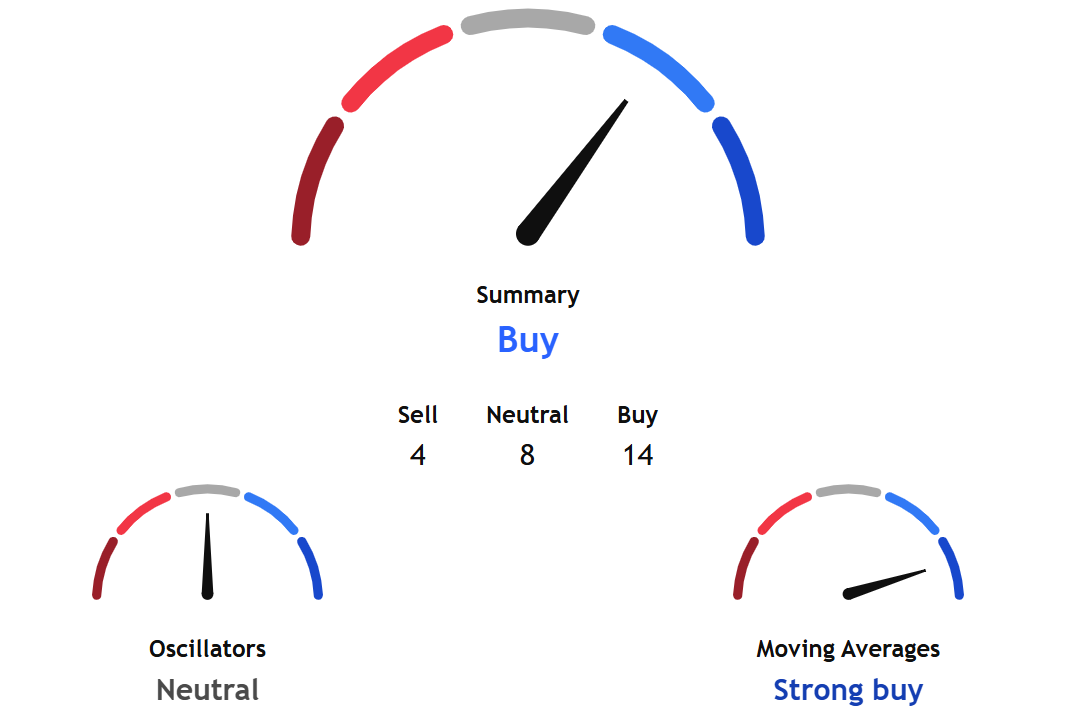
TradingView's technical analysis overview for the coming week based on key data from moving averages, oscillators, and pivots showed a buy signal.
While the short-term sub-gauges of oscillators showed a neutral stance, the long-term indicators under moving averages pointed to a strong buy stance.
Separately, InvestTech's Algorithmic Overall Analysis and recommendation for one to six weeks was a positive score.
The research noted, "Bitcoin is in a rising trend channel in the short term. This shows that investors over time have bought the currency at higher prices and indicates good development for the currency."
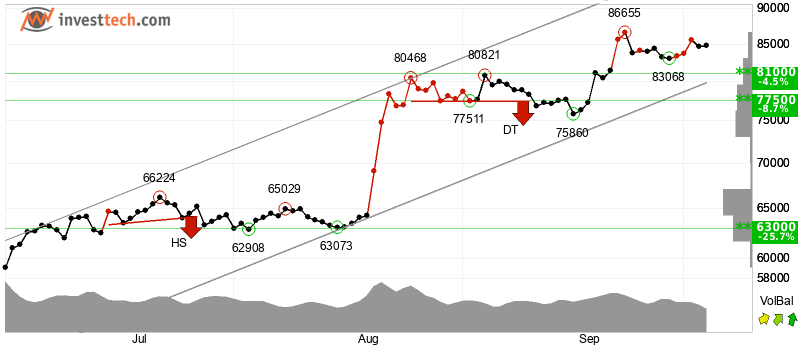
InvestTech added, "There is no resistance in the price chart, and a further rise is indicated. In case of a negative reaction, the currency has support at approximately 81000 points. The currency is assessed as technically positive for the short term."