



Bitcoin is the least damaged of the three largest majors. It closed at $58,461.72 on 20 November, 19.5% under its 200-day average, with a 14-day relative strength index of 17.3. Ethereum closed 24.7% below the same average and Solana 23.1% below it.
That is a relative answer to the question people are actually typing this week, and it deserves to be read narrowly. Least damaged is not the same as cheap. All three tokens are trading at or near twelve-month lows, the macro calendar still has a rate decision on it, and the positioning data below says leverage has not been washed out. What the numbers do support is a ranking: if you are going to own one of the three through this drawdown, bitcoin has the least stretched entry on every measure I could compute from a year of daily closes.
Three Majors, One 200-Day Line, Three Different Gaps
I pulled 365 daily closes for each asset from CoinGecko and computed the moving averages, the RSI and the realized volatility myself, because published screeners disagree on how they annualize. The table below is the output as of the 20 November close.
| Measure | Bitcoin | Ethereum | Solana |
|---|---|---|---|
| Close, 20 Nov 2026 | $58,461.72 | $1,605.07 | $68.07 |
| Change, 24 hours | -5.93% | -8.92% | -7.03% |
| Change, 30 days | -29.52% | -34.39% | -36.02% |
| 200-day average | $72,627.46 | $2,131.92 | $88.55 |
| Price vs 200-day | -19.5% | -24.7% | -23.1% |
| Gain needed to reclaim it | +24.2% | +32.8% | +30.1% |
| RSI, 14-day | 17.3 | 19.2 | 23.4 |
| Drawdown from record | -53.6% | -67.6% | -76.8% |
| Realized volatility, 30 days, annualized | 47.7% | 64.1% | 62.1% |
The gaps are close enough that a bad week reorders them. Ether’s 24.7% shortfall from its 200-day line is 5.2 points worse than bitcoin’s; solana’s 30-day loss is 6.5 points worse. Bitcoin’s volatility is the outlier: 47.7% annualized against the low sixties for the other two. For anyone sizing a position rather than calling a direction, that difference is the whole argument.
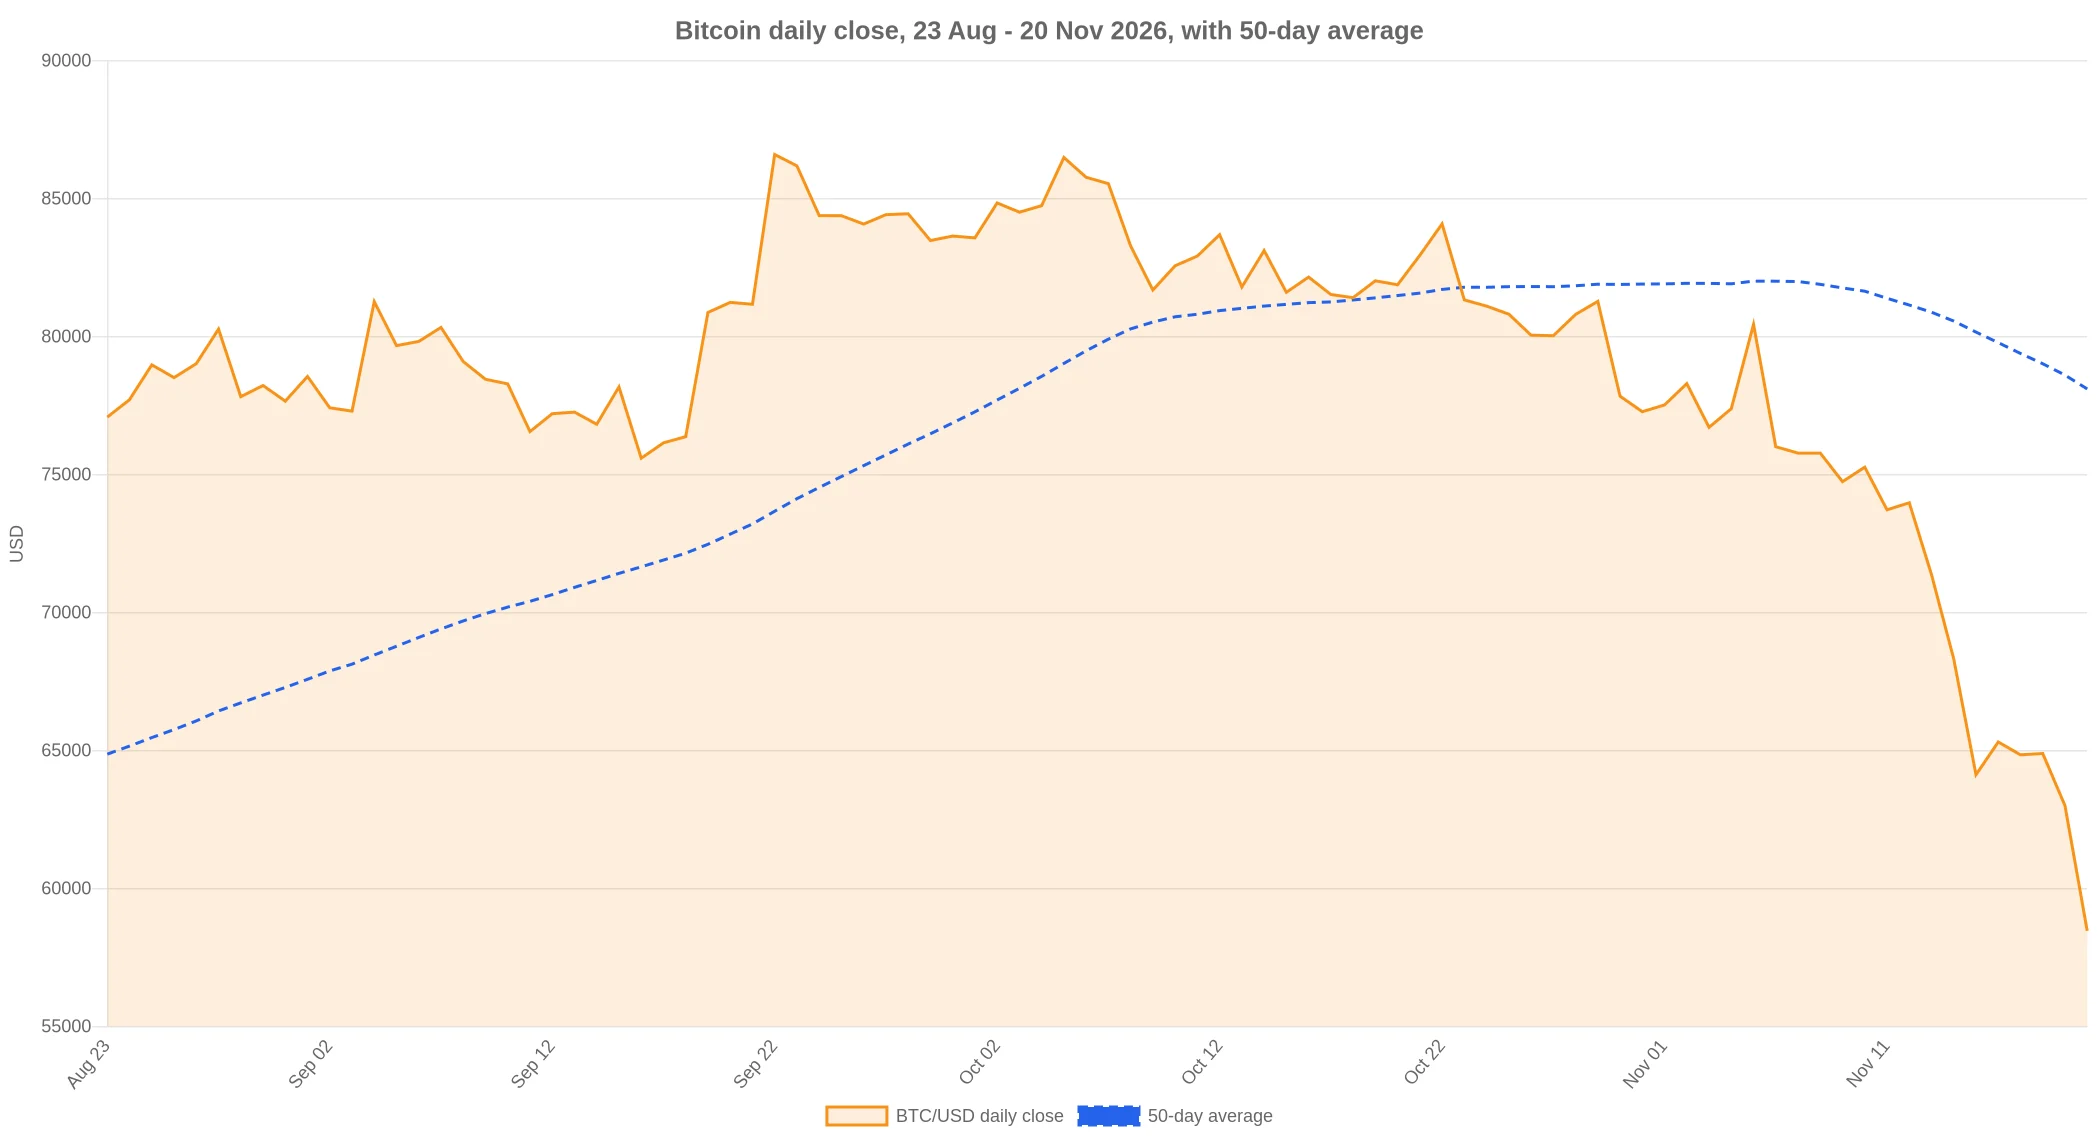
The chart also makes a point that headlines miss. Bitcoin spent most of the last ninety sessions between $78,000 and $88,000, and the entire move below the 200-day line happened in roughly two weeks. This is not a slow bleed that gave holders time to adjust. It is a repricing that arrived all at once, which is why the 200-day gap is wider than the 30-day change implies.
Oversold Is a Reading, Not a Signal
An RSI of 17.3 is unusual. On a 14-day Wilder calculation it means the average down day has overwhelmed the average up day by a wide enough margin that the oscillator has almost no room left at the bottom of its range. Traders call that oversold and treat it as a reason to buy. The data does not cooperate with that reflex.
Nothing in the construction of the indicator says a market must rise after it prints a low reading. A downtrend in which every bounce fails will keep the RSI pinned near the floor for weeks, and each new leg lower refreshes the calculation. What the reading tells you is that selling has been persistent and one-directional. What it cannot tell you is whether the sellers are finished.
The honest use of the number is comparative, and that is where it earns its place today. Bitcoin at 17.3, ether at 19.2 and solana at 23.4 all sit in the same washed-out zone, which means the market is not discriminating between the three on momentum. If you believe the drawdown is a buying opportunity, the momentum data gives you no reason to prefer the smaller caps. If you believe it continues, the same data gives you no reason to think bitcoin is protected.
The Leverage That Never Left: 4% of Contracts, 27% of Dollars
Here is where the week’s numbers get interesting, and where a casual read of the tape goes wrong.
Binance’s BTCUSDT perpetual open interest fell from $8.24 billion on 22 October to $6.01 billion on 20 November, a drop of 27% that sounds like a market purging its leverage. It is mostly an accounting effect. Open interest measured in contracts fell from 101,152 BTC on 13 November to 96,999 BTC, a decline of 4.1%.
Decompose it. At the contract peak, open interest was $8.24 billion against 101,152 BTC, implying an average mark near $81,461. By 20 November the average mark was $61,959. Hold the contract count fixed and that price change alone removes about $1.97 billion of notional. The actual reduction in positions accounts for roughly $257 million, or 12% of the fall. The other 88% is bitcoin getting cheaper, not traders closing.
Funding tells the same story from the other side. The last seven settlements on that perpetual averaged +0.0042% per eight hours, about 4.6% annualized, and only four of the last twenty-one settlements were negative. A long carried through this crash has kept paying to stay long: $37.80 a month on a $10,000 position at that rate, in a market that has fallen 29.5% in thirty days. That is not capitulation. Capitulation shows up as negative funding and a collapse in contracts, and neither has happened. BlockchainReporter documented the same pattern in the first leg of this slide on 19 November, when funding stayed positive through a 23% decline.
The Fed Kept December on the Table in Its Own Words
The macro layer is not ambiguous, and it is not priced as a rescue. The minutes of the Federal Open Market Committee’s 27-28 October meeting, published on 18 November, record a committee that held the target range at 3-3/4 to 4 percent by a 10-2 vote while treating a hike as the next move rather than a cut.
The relevant passage is about the path, not the decision. “The federal funds rate path implied by futures prices was little changed, on net, over the period, with little chance of a rate increase associated with this meeting but high probabilities assigned to a 25 basis point hike by year-end and two more by the summer of 2027.” The Desk’s own survey median had one hike in December, another in March 2027, and a cut only in early 2028.
The dissent ran the other way. “Some participants favored an increase of 25 basis points in the target range at this meeting, emphasizing that inflation had remained too high and that they saw few signs of it abating.” And on the direction of travel: “almost all participants judged that, under their baseline outlooks for inflation and the labor market, further action to raise the target range for the federal funds rate—broadly consistent with the September Summary of Economic Projections—would likely be appropriate, in order to ensure a timely return of inflation to the 2 percent objective.”
The committee is working with a 3.6% twelve-month PCE reading for September, and the staff flagged in the same document that “the possibility that longer-run inflation expectations could have become unanchored after five years’ worth of elevated inflation” was a salient risk. That is the backdrop for the next decision, scheduled for 8-9 December 2026 , which also carries a Summary of Economic Projections.
For a crypto buyer this matters mechanically. A hike in December raises the return on the risk-free alternative in the same month that bitcoin is already 19.5% below its trend line. It does not guarantee another leg down. It does mean the “nothing left to price in” argument is not available.
What a Double Would Mean in Market Value
Search traffic around this trade always wants a multiple. The arithmetic is worth running because it disciplines the conversation.
Bitcoin’s market value is $1.177 trillion at $58,502 with 20.11 million coins outstanding. A double puts it at $2.353 trillion. Its record price of $126,080, applied to today’s supply, implies $2.536 trillion. So a full double from here still lands 7.2% below the market value bitcoin reached at its peak. Ether needs a double to reach $392 billion, against $604.6 billion implied by its record on today’s supply, a 35% shortfall. Solana doubles to $80.6 billion against $173.6 billion, a 54% shortfall.
Put differently: the cheapest-sounding target on the table, a 2x, requires $1.18 trillion of net new money to enter bitcoin alone in a month where the Fed is discussing tightening and perpetual funding is already positive. That is the number to hold against any claim that a snap-back is mechanical.
The comparison to last week’s setup is instructive. On 18 November bitcoin was 11.9% lower over a week and the argument was whether the fall had overshot. Two sessions later the weekly loss is 15.1%, and the question has changed from overshoot to duration.
The Case for Waiting
Three things argue against treating this as a clean entry.
First, the absence of a funding flush means the marginal long has not been forced out. Historically the durable lows in this market have arrived with negative funding and a visible drop in open interest, not with longs still paying a small premium to hold.
Second, the technical damage is fresh. A price 19.5% below its 200-day average with the average still declining has no trend support underneath it, only prior consolidation levels. The $78,000-$88,000 range that held through September and October is now overhead supply, and it is 33% to 50% above spot. Every rally into it meets sellers who bought there.
Third, the sample is one year. A 365-day window is enough to compute a 200-day average and an RSI, and it is not enough to say what a normal drawdown looks like for an asset that has only traded under this market structure for a few years. The metrics describe the current state precisely. They do not forecast.
The Levels That Decide the Next Leg
Two prices matter, and both have a stated basis.
On the downside, $57,799 is the 20 November intraday low, and $58,461.72 is the close. A daily close below the intraday low would confirm that the session’s buyers were absorbed and put the market in price discovery with no computed support beneath it. That is the invalidation for any long-side thesis built on this week’s bounce attempt.
On the upside, $72,627.46 is the 200-day average itself, and it is the only level in this analysis with a methodological basis rather than an eyeballed round number. A weekly close above it would end the current trend definition. Between spot and that level there is nothing but the overhead range, which is why the +24.2% figure in the table is the honest description of what a repair requires.
The next forced input is the 8-9 December meeting. Between now and then the only scheduled data that resets this picture is the inflation print ahead of it, and the weekly closes against the 200-day line.
Frequently Asked Questions
No indicator in this dataset answers that question. What the data shows is that all three majors are 19% to 25% below their 200-day averages, that bitcoin is the least stretched of the three, and that perpetual funding is still positive, which means leverage has not been forced out. Those facts describe a market under pressure, not a market that has bottomed.
On a 14-day calculation it means the average down day has heavily outweighed the average up day across the window, placing the oscillator near the bottom of its range. It is a description of recent selling pressure. It is not a timing signal, and an RSI can stay depressed for weeks while price keeps falling.
Bitcoin, on all four measures used here: a 19.5% gap to its 200-day average against 24.7% for ether and 23.1% for solana, a 53.6% drawdown from its record against 67.6% and 76.8%, and 47.7% annualized 30-day volatility against the low sixties. Strongest is relative. All three are in the same oversold zone.
It is the mean of the last 200 daily closes, a standard trend measure that smooths out single sessions. Bitcoin’s sits at $72,627.46. Price below it means the medium-term trend is down, and the distance from it measures how far the market has traveled from its own recent norm.
A weekly close above $72,627.46, the 200-day average, would end the current downtrend definition. A daily close below $57,799, the 20 November intraday low, would remove the last computed support. Negative perpetual funding combined with a sustained drop in open interest would show that leverage has finally been cleared, which is the condition that has preceded durable lows in this market.
Prices are CoinGecko daily closes for 20 November 2026; moving averages, RSI and volatility are computed from that series; open interest and funding are Binance BTCUSDT perpetual data through the 20 November 16:00 UTC settlement; policy language is quoted from the Federal Reserve’s October meeting minutes .
Data: CoinGecko , Binance Futures , Federal Reserve .
Disclosure: This article does not represent investment advice. The content and materials featured on this page are for educational purposes only.
The post Best Crypto to Buy Now: Bitcoin’s RSI Is 17.3 and Its 200-Day Gap Is the Smallest of the Three Majors appeared first on BlockchainReporter .