



Bitcoin traded at $63,696 at 02:11 UTC on Sunday, 6.6% lower over 24 hours and 49.5% below the record high of $126,080 it set on Oct. 6, 2025. Earlier in the session it printed $62,603, below the Aug. 17 low of $62,844 and the weakest price since mid-August. The total crypto market cap fell 9.7% to $2.16 trillion, ether lost 8.5%, Solana 9.3%, XRP 7.7% and Dogecoin 10.4%.
The weekly arithmetic is the part that matters for anyone holding through the weekend. Bitcoin closed last Sunday at $74,740, which was itself the fifth consecutive lower weekly close since the $86,490 print on Oct. 5. Sunday’s price sits 14.8% under that level, so the current week is on course to become the sixth straight loss. That is a sequence, not a single bad day, and it has now removed nearly a quarter of bitcoin’s value over the past month.
Three measurable pressures sit behind the move: a Treasury curve that repriced higher through the week, spot ETF flows that have not turned positive since Nov. 4, and the positioning that the Federal Reserve’s own November financial stability report , published on Nov. 13, described in public three days before the selloff. What follows separates what the data proves from what it merely allows.
What the weekend wipeout actually looked like
| Asset | Price, 02:11 UTC | 24 hours | Market cap | From record high |
|---|---|---|---|---|
| BTC | $63,696 | -6.59% | $1.281 trillion | -49.48% |
| ETH | $1,760.67 | -8.53% | $215.2 billion | n/a |
| SOL | $69.53 | -9.34% | $41.1 billion | n/a |
| XRP | $0.9264 | -7.67% | $58.9 billion | n/a |
| DOGE | $0.05738 | -10.41% | $9.0 billion | n/a |
Source: CoinGecko quotes pulled at 02:11 UTC on Nov. 15, 2026.
The aggregate number is the one to keep in view. A 9.7% one-day decline on a $2.1634 trillion market implies a starting capitalization of roughly $2.396 trillion, which puts the value removed in 24 hours at about $232 billion . Bitcoin’s own share of the damage is larger in absolute terms: at 49.48% below the record, its $1.281 trillion market cap implies a peak capitalization near $2.536 trillion, so about $1.26 trillion of paper value has gone from the largest crypto asset since October 2025.
Bitcoin dominance at 58.55% tells a quieter story. In a genuine flight out of the asset class, dominance usually rises as the smaller names fall harder. It did rise slightly, but altcoins did not underperform dramatically: ether, Solana and XRP all fell between 7.7% and 9.3% against bitcoin’s 6.6%. That pattern is consistent with a broad de-risking of the whole complex rather than a rotation out of bitcoin specifically. It does not prove that reading, because a 24-hour window is too short to separate the two.
The Fed published the risk three days early
The Board of Governors released its November report on Nov. 13, with market data through Oct. 28. Its first vulnerability category is asset valuations, and the summary language is unusually direct for a document of this kind:
“Asset valuation pressures continued to be elevated.”
That sentence covers equities, corporate credit and real estate, not crypto. The report mentions bitcoin nowhere, and its entire treatment of digital assets is a short passage on stablecoins that we covered on Saturday . What matters for crypto is the transmission channel the report describes, because the same leverage and rate dynamics reach every risk asset, including ones the Federal Reserve does not name.
Two passages do that work. The first is about non-bank leverage:
“Leverage at hedge funds reached the highest level since the data began in 2013 and was concentrated in a small number of large funds.”
The second is about the discount rate applied to every long-duration asset:
“Treasury yields across 2- and 10-year maturities climbed markedly since the May report and remained well above their average levels over the past 15 years.”
The Treasury’s own daily par yield curve shows where that landed. On Nov. 13 the 10-year closed at 5.15%, the 2-year at 4.88% and the 30-year at 5.47%. A 10-year at 5.15% is the number that matters for an asset with no cash flow, because it is the return available without taking price risk at all.
The report’s survey of market contacts, conducted in September and October, listed the risks those contacts considered most consequential for the financial system: artificial intelligence, a risk-asset correction, higher long-term rates, cyberattacks and fiscal debt sustainability. A risk-asset correction was already on the list the Fed published. Nothing in the document predicted a crypto selloff, and it would be a misreading to say it did. The more precise statement is that the vulnerability the Fed flagged, elevated valuations sitting on top of the highest hedge fund leverage in more than a decade, is the condition under which a 7% move in bitcoin becomes a 10% move in the average altcoin.
Seven sessions of ETF redemptions, and one small crack in the pattern
US spot bitcoin funds have now recorded net redemptions in seven consecutive sessions. The Farside Investors daily table runs Nov. 5 through Nov. 13 and reads, in millions of dollars: -430.2, -411.9, -201.0, -95.0, -299.8, -284.1 and -185.4. The seven-day total is -$1,907.4 million , and the last positive day before the sequence was Nov. 4, at +$74.6 million.
Friday’s session is worth isolating because of how concentrated it was. IBIT redeemed $143.5 million and FBTC $41.9 million, and those two figures sum to exactly the day’s total outflow of $185.4 million. Every other fund in the table was flat at zero. When two funds account for the whole net move, the flow is a decision by a small number of allocators, not a market-wide stampede, and it can reverse on the same desk’s next rebalance.
Ether funds show the first crack in that pattern. After six negative sessions totalling -$594.4 million through Nov. 12, the group recorded a +$2.3 million net inflow on Nov. 13, with FETH adding $11.6 million against a $9.3 million redemption in ETHE. Two million dollars is noise against a $215 billion asset, and it is not evidence of a turn. It is, however, the first non-negative print in a week, and it is the kind of detail that precedes a change in direction more often than a headline does. Farside had not published Nov. 14 figures at the time of writing.
The levels that matter, and what they do not prove
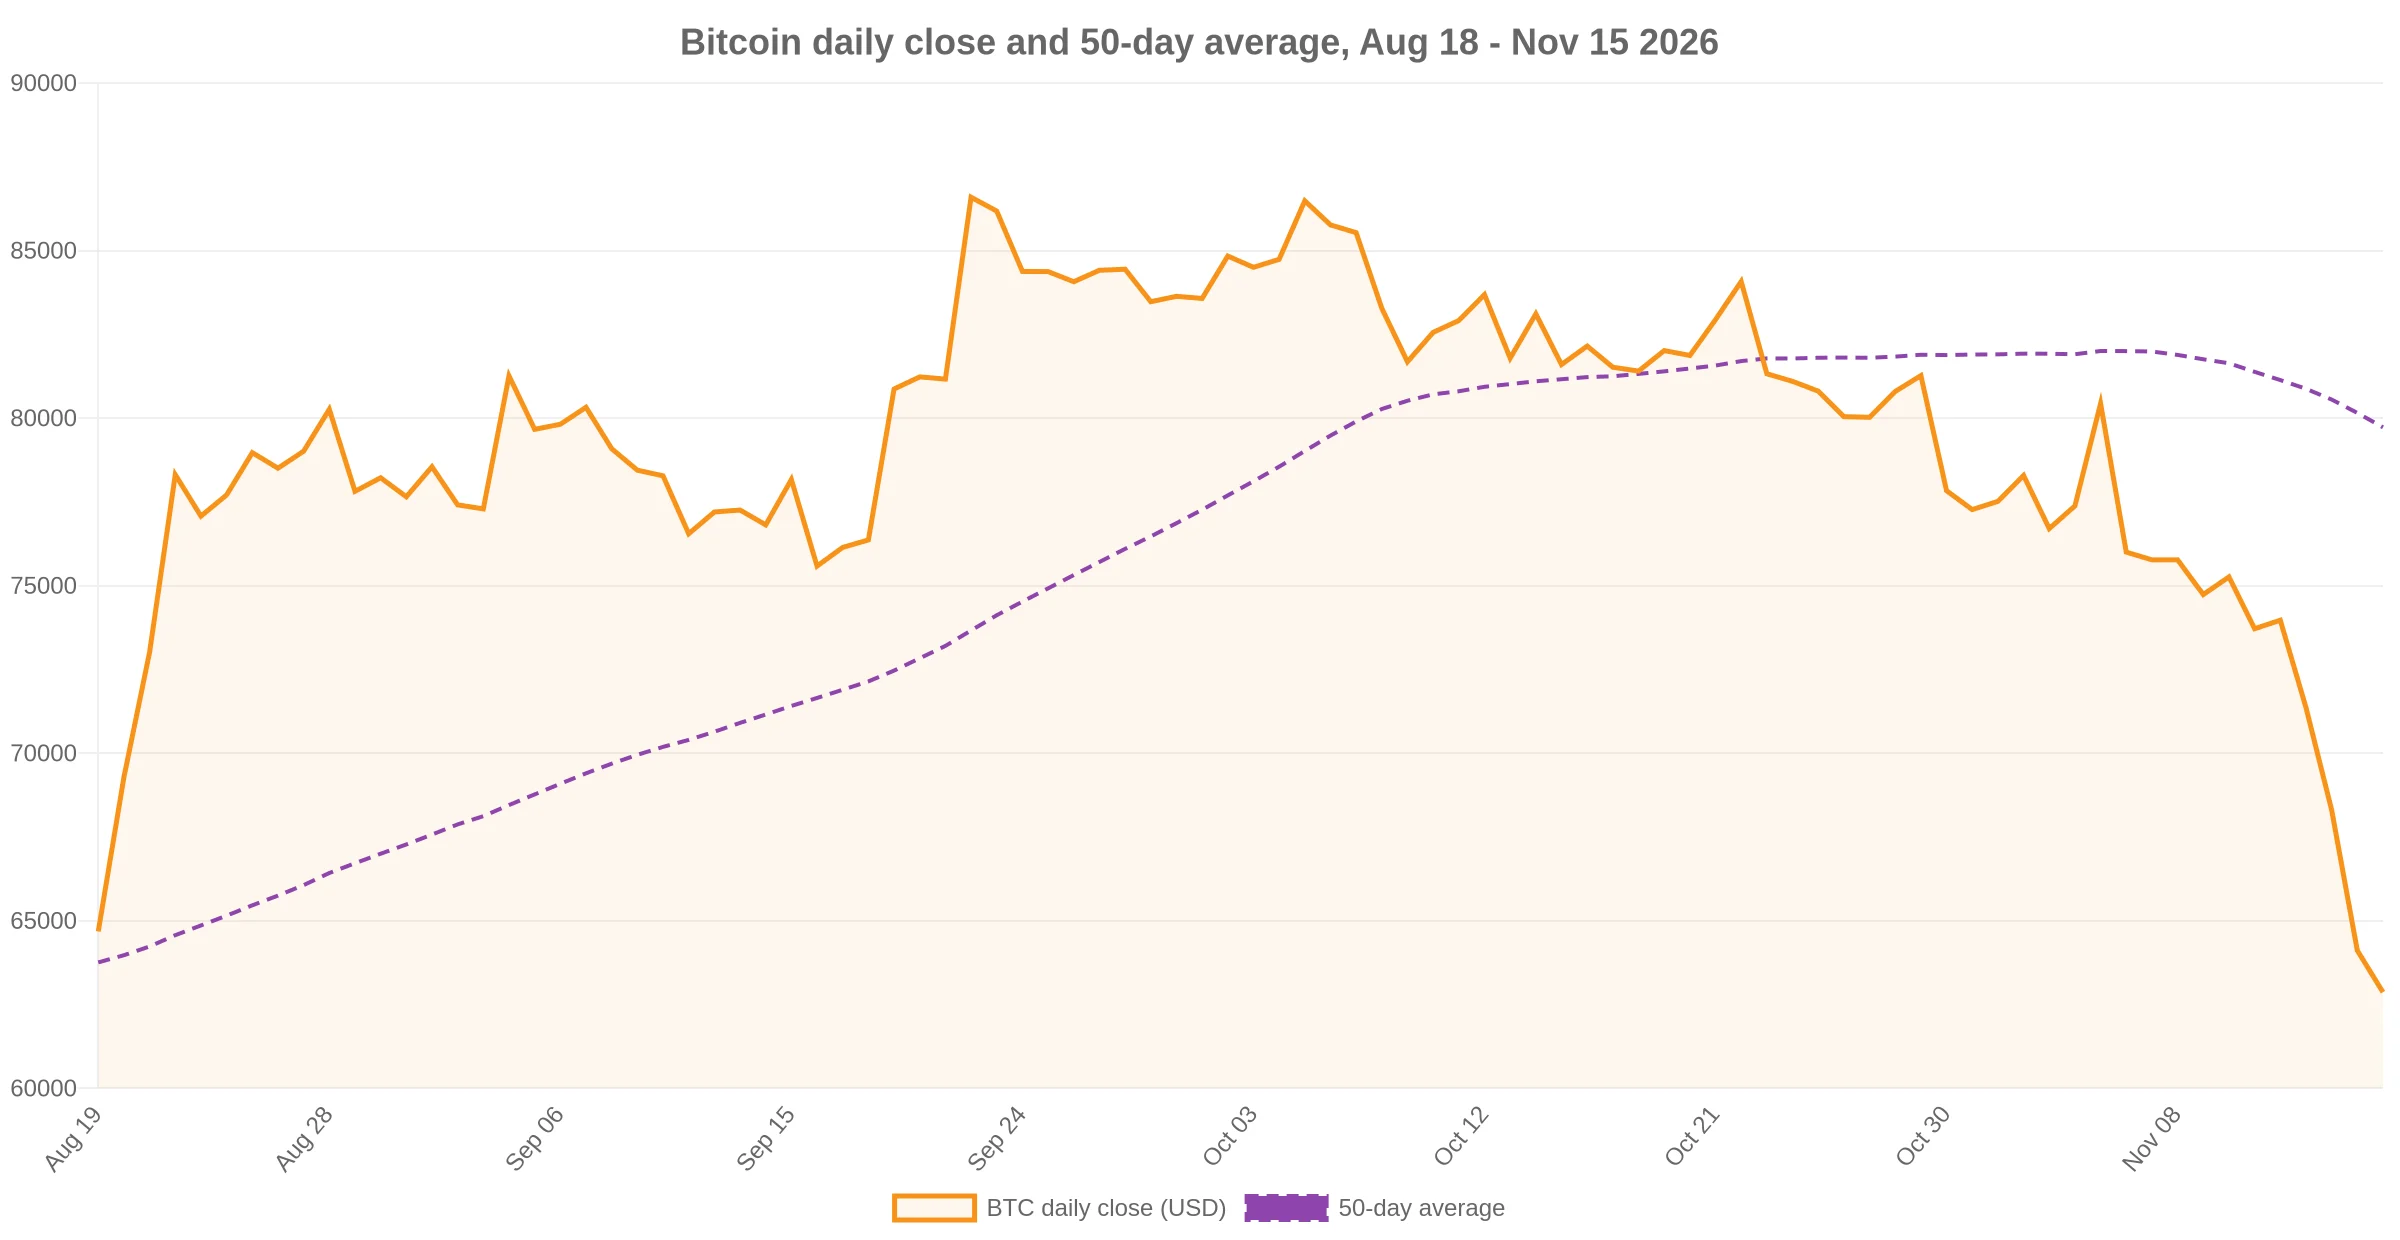
Every average below is a simple mean of daily closes from the CoinGecko series, computed rather than copied, and every distance is stated against the 02:11 UTC quote of $63,696. The $66,000 to $68,000 band that Coinbase Institutional published and we examined on Nov. 14 , when bitcoin traded at $66,999, has since been lost: the current price is 3.5% below the bottom of it.
- 20-day average: $75,015. Bitcoin trades 15.1% below it, and has closed under it every day since Nov. 6.
- 50-day average: $79,746. The gap is 20.1%, the widest of the three, which is what a fast decline does to a slow average.
- 200-day average: $72,922. Bitcoin is 12.7% below it, having lost that line on Nov. 13 after holding it through the October decline.
A reclaim of the 200-day at $72,922 would require a 14.5% rally from here, and it is the first level at which the weekly sequence would come under real pressure. On the downside, the Aug. 17 close of $62,844 has already been broken intraday; below it, the only reference in the last eight months is the July 1 close of $58,566, which is 8.1% under the current price.
None of that is a forecast. Moving averages describe where past prices settled; they do not create demand. The honest use of these levels is to define what would falsify the current downtrend, which is a reclaim and hold above $72,922, and what would confirm it, which is a daily close below $58,566.
A fear index at 10 measures the crowd, not the floor
The Crypto Fear and Greed Index printed 10 on Sunday, in its “extreme fear” band. The path there was fast: 13 on Saturday, 20 on Friday, 28 on Thursday, 29 on Wednesday, 32 on Tuesday. The last reading at or below 10 came on June 10, and before that the index spent late March and early April in the same zone, with prints of 8 on March 23 and March 30, 9 on March 29 and April 3, and 8 on April 1.
The index is built from volatility, market momentum and volume, social media activity, surveys, dominance and search trends. Valuation is not one of its inputs, which is why it can sit at 8 while an asset is still expensive and at 15 while it is cheap. It measures how the crowd feels, and crowds can stay frightened through a bottom and through a further 20% decline. Treating 10 as a buy signal is a claim about mean reversion in sentiment that the index itself does not support.
What would change the picture
Three checkable conditions, in order of how quickly they could appear. First, a daily close back above the 200-day average at $72,922, which would break the sequence of lower weekly highs that has held since late September. Second, two consecutive sessions of positive net flows across the spot bitcoin funds, which would end a streak that is now seven sessions old. Third, the 10-year Treasury yield falling back below 5%, which would remove the discount-rate pressure the Fed’s report described without predicting anything about crypto prices.
Until at least one of those happens, the accurate description of this market is a leveraged, high-valuation asset class unwinding inside a rate environment that got tighter, with flows still pointing out of the door and sentiment at an extreme. That is a description of conditions. It is not a call on where the price goes next.
Data: CoinGecko , Farside Investors , alternative.me , U.S. Treasury .
Frequently Asked Questions
Bitcoin traded at $63,696 at 02:11 UTC on Nov. 15, down 6.59% in 24 hours and 49.5% below its Oct. 6, 2025 record of $126,080, after printing $62,603 earlier in the session. The move extends a sequence of five consecutive lower weekly closes, with the current week on course to be the sixth. The measurable pressures are a 10-year Treasury yield at 5.15% on Nov. 13, seven straight sessions of net redemptions from US spot bitcoin funds totalling $1,907.4 million, and a market the Federal Reserve’s November stability report described as carrying elevated valuations on top of the highest hedge fund leverage since 2013.
At $63,696, bitcoin is 49.48% below the $126,080 record set on Oct. 6, 2025, according to CoinGecko data pulled at 02:11 UTC on Nov. 15, 2026. In market-cap terms that is roughly $1.26 trillion of value removed from the asset, calculated by comparing the current $1.281 trillion capitalization with the implied peak capitalization of about $2.536 trillion.
No index reading is a buy signal on its own. The index at 10 means volatility is high, momentum is negative, social activity is defensive and bitcoin’s share of the market is rising, which is how extreme fear is constructed. It does not include valuation, and the index has spent multiple sessions near 8 in March, April and June 2026 without marking a durable low on the day it first printed there.
Yes, through the last published session. Farside Investors records net redemptions in seven consecutive sessions from Nov. 5 to Nov. 13, totalling $1,907.4 million, with $185.4 million leaving on Nov. 13 alone from IBIT and FBTC. Nov. 14 figures had not been published at the time of writing, so the streak’s status for that session is unknown.
Using simple averages of daily closes from CoinGecko, the 20-day average sits at $75,015, the 50-day at $79,746 and the 200-day at $72,922, all above the current price. A reclaim and hold above the 200-day would be the first evidence the downtrend had stopped; a daily close below the July 1 low of $58,566 would extend it. These are descriptions of past price behaviour, not predictions.
wrote 2006
This article is not investment advice. Price and flow figures are as of the timestamps stated and change continuously.