




Ethereum traded at $2,234.61 at 04:42 UTC on 8 November, 17.0% below its $2,691.35 close thirty days earlier. Bitcoin fell 9.9% over the same window, from $84,090 to $75,800. The ETH/BTC ratio, which measures the two assets against each other rather than against the dollar, now sits at 0.029466. A $1,000 position at today’s price buys 0.4475 ETH. For that position to become $10,000, ether has to trade at $22,346.10, a price that would value the network at $2.73 trillion.
The spot checks line up across venues. Coinbase printed $2,233.32 on ETH-USD at 04:40:33 UTC and $75,797.06 on BTC-USD in the same minute, according to the exchange’s public ticker feed . Kraken quoted $2,233.73 for ETH and $75,800.70 for bitcoin in its daily OHLC feed . CoinGecko’s aggregate put ether at $2,234.61 with a market capitalization of $273.10 billion. Divide the two and the ratio is 0.029466, the number every argument below rests on.
What the Current Price Buys in Market-Cap Terms
The dollar price is the least informative number on the screen. Market capitalization is what a buyer is actually paying for: at $2,234.61 and $273.10 billion, the implied circulating supply is 122.21 million ETH. Bitcoin, at $75,836 and $1.525 trillion, implies 20.11 million coins. Ether is therefore worth 17.9% of bitcoin’s entire valuation.
That ratio defines the arithmetic of any target. A double for ether is $4,469.22, which at constant supply is a $546.2 billion market cap, or 35.8% of bitcoin’s current capitalization. A tenfold move is $22,346.10 and $2.731 trillion, which is 1.79 times bitcoin’s valuation today. Neither figure is impossible. Both describe what would have to be true about relative demand, and neither is implied by a chart pattern.
The rest of the market frames that comparison. Total crypto market capitalization is $2.564 trillion, bitcoin’s dominance is 59.35% and ether’s is 10.63%, per CoinGecko’s aggregate data. Solana is at $89.08 for a $52.66 billion cap; XRP is at $1.16 for $73.75 billion; BNB trades at $695.53 for $91.47 billion. Ether remains the second-largest asset by a wide margin, and it is still priced as though the market expects bitcoin to keep the larger share of any new money.
The Ratio, Not the Dollar Price, Is Where Ether Lost Ground
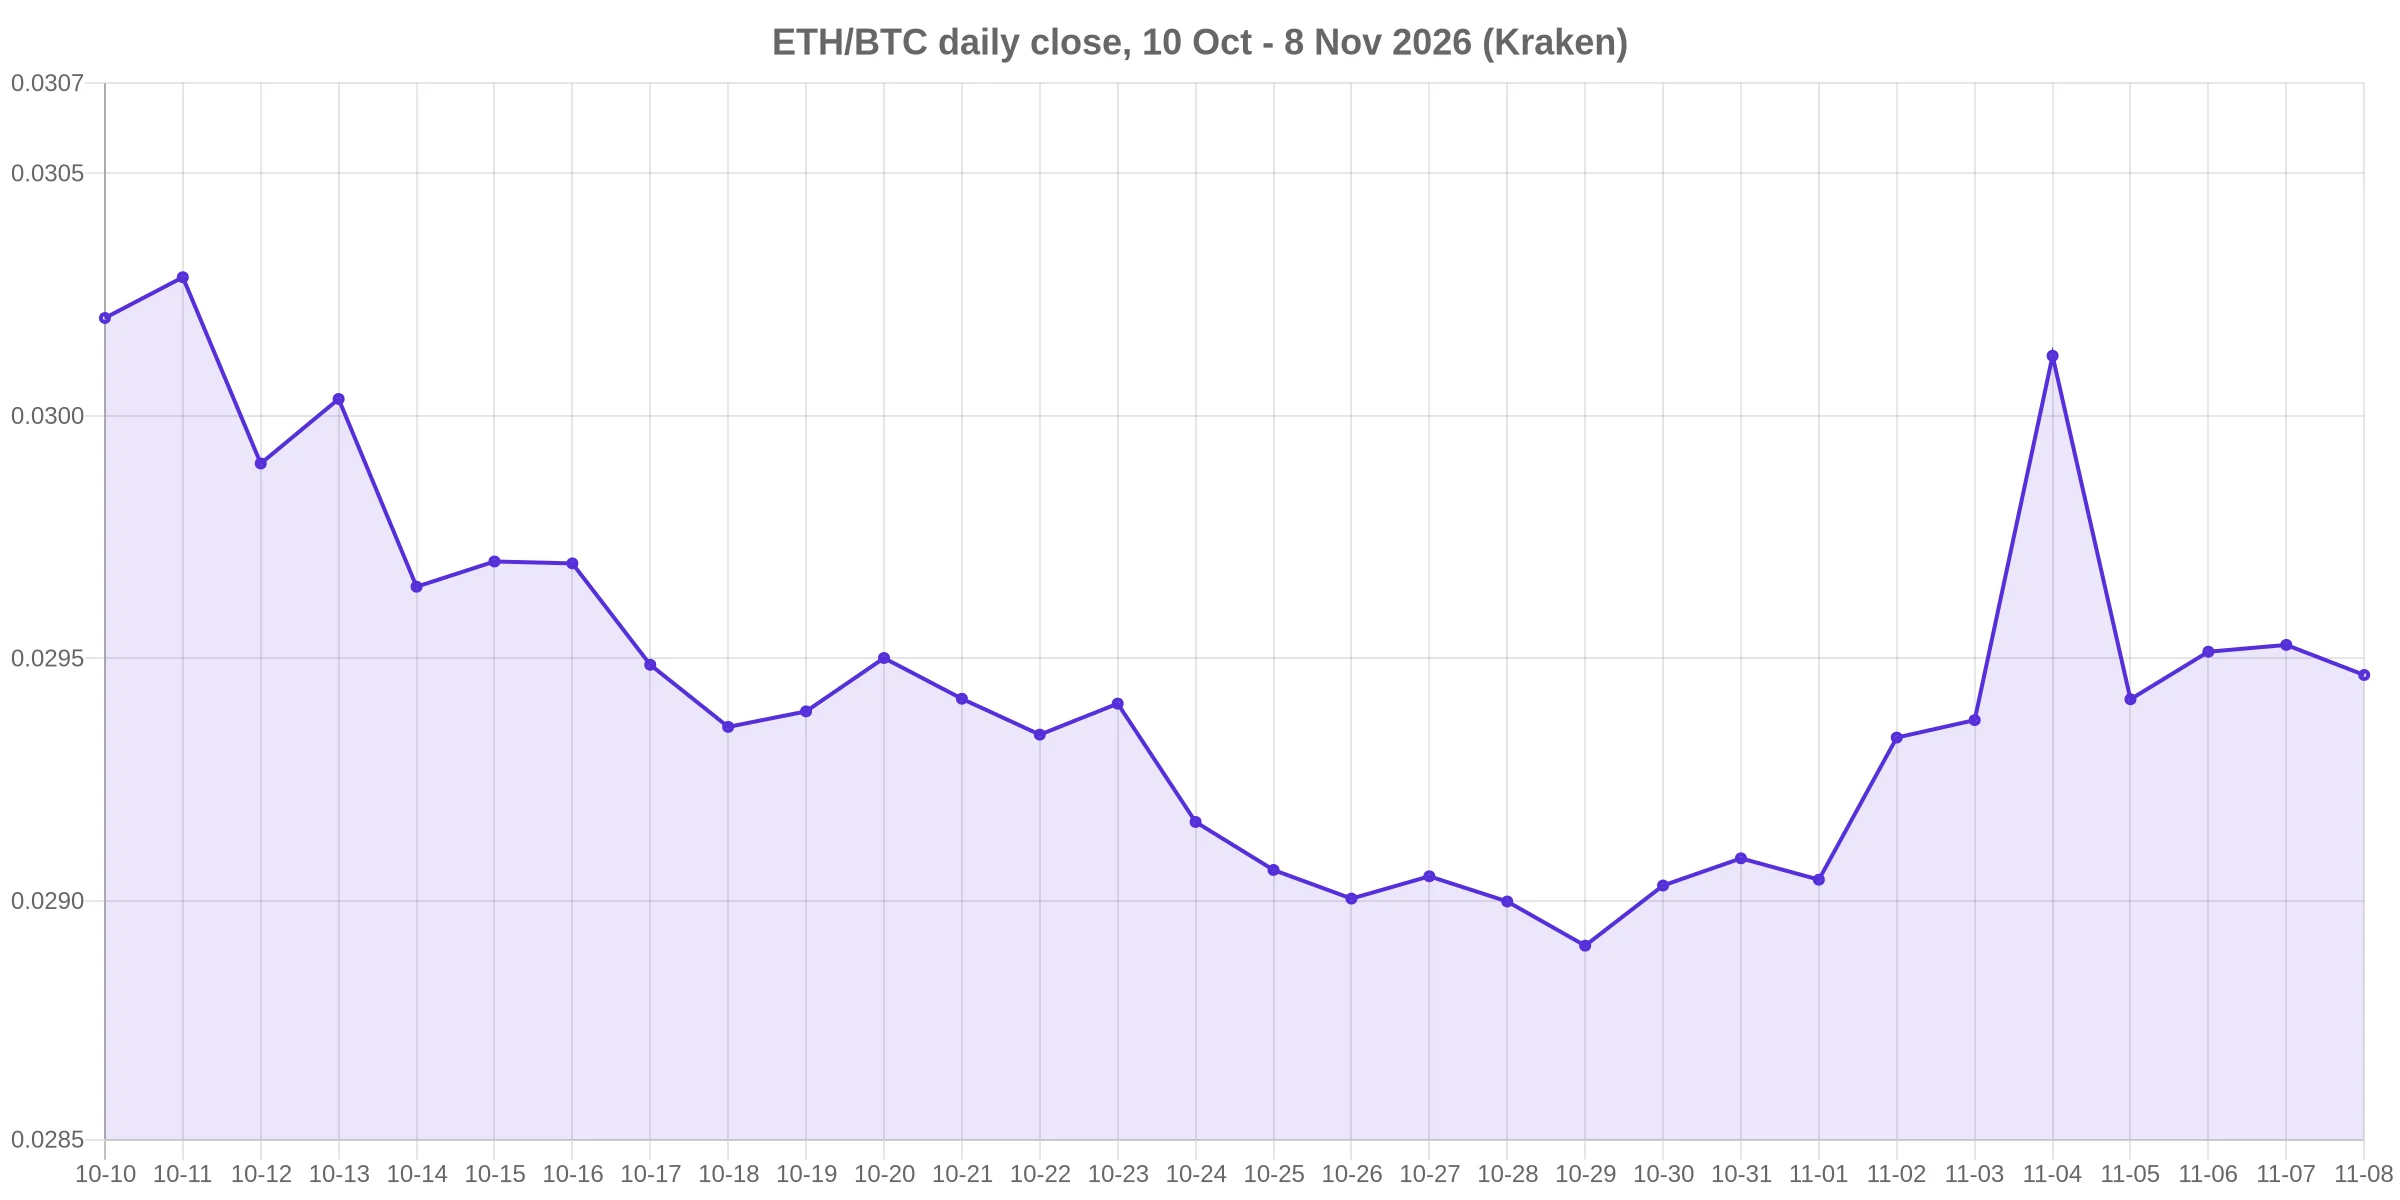
Over the last 30 daily closes on Kraken, ETH/BTC has traded between 0.028908 and 0.030286. It touched the low end on 29 October, recovered to 0.030124 on 4 November, and has drifted back to 0.029466. On 10 October the ratio closed at 0.030202. On 25 September it was 0.032005. Returning to the October level needs a 2.5% gain in the ratio; returning to late September needs 8.6%.
Those are small percentages in a market that moves several percent a day, which is exactly why the ratio matters more than the headline price. Ether can rise 5% in dollars and still lose ground against bitcoin if bitcoin rises 7%. A holder who bought ETH in dollars is measuring one thing; a holder who rotated out of BTC is measuring another. The two have diverged for six weeks.
What the data does not show is a single cause. Over the 30 sessions to 8 November, ether lost 17.0% while bitcoin lost 9.9%, and none of the price feeds examined here carry an attribution. Claims that a specific flow, cohort or headline drove the move would need position, flow or holder data that this dataset does not contain. The measurable fact is the direction and size of the relative move, not its author.
Where a $1 Trillion Valuation Actually Sits
Converting a market-cap target into a price makes cross-asset comparisons honest. On the implied supplies above, a $1 trillion valuation requires $8,182.38 per ETH, 3.66 times the current price. Solana would need $1,691.59, 19.0 times its $89.08. XRP would need $15.73, 13.6 times its $1.16. Bitcoin passed the threshold long ago: $49,720.90 per coin would already be enough at its current supply.
The ordering is counter-intuitive in a useful way. XRP’s market cap, $73.75 billion, is 1.40 times Solana’s $52.66 billion, so XRP needs the smaller multiple to reach the same round number. A reader comparing “which asset can 10x” is really comparing float, unlocks and dilution, not technology. Ether’s 3.66 times to $1 trillion is the smallest multiple among the three because its supply is fixed in practice and its cap is already the largest of them.
Ethereum’s Next Cost Change Is a Gas Repricing
The dated development on the Ethereum side is not a price event. Two proposals that change what state costs on the network are marked Last Call, with a listed Last Call deadline of 1 November 2026, and both remain “in the process of being peer-reviewed” on the official proposal pages.
EIP-8038 is titled “State-Access Gas Cost Update”. Its abstract states: “This EIP updates the gas cost of state-access operations to reflect Ethereum’s larger state and the consequent slowdown of these operations.” The motivation section is equally direct: “The gas price of accessing state has not been updated for quite some time.” It adds that “EIP-2929 was included in the Berlin fork in March 2021 and raised the costs of state-accessing opcodes.”
EIP-8037 covers the other half: “Harmonization, increase and separate metering of state creation gas costs to mitigate state growth and unblock scaling”. It requires, among others, EIP-8038, and EIP-8038 in turn requires EIP-8037, so the two are read together.
Read the documents for what they claim and what they do not. They change the cost of creating and accessing state. They do not change issuance, they do not alter the fee burn, and the proposal pages do not state which network upgrade will carry them or on what date. Anyone who tells you the repricing ships in a named fork is ahead of the published record. The eight invariant failures that auditors were asked to test in this work are the subject of the earlier audit report , which is the place to start for the mechanics.
The Levels That Would Invalidate the Case
Support and resistance have to come from data, not from memory. On Kraken daily closes, ether’s 30-session low is $2,170.00 and the high is $2,576.94. The last seven sessions set a tighter band of $2,201.26 to $2,447.27, with the high printed on 4 November when ETH closed at $2,423.16 after touching $2,447.27 intraday. Spot at $2,234.61 sits 2.9% above the 30-day low and 13.3% below the 30-day high. Bitcoin’s own 30-session range is $74,790 to $84,840.
Those four numbers define the invalidation conditions rather than a forecast. A daily close below $2,170 breaks the base that has held for a month and shifts attention to whatever the next measured range turns out to be, which this dataset cannot name in advance. A close above $2,447.27 removes the lower-high pattern that has capped every bounce since 4 November. The levels are descriptive: they are where trades actually happened, not where they must happen next.
What Would Change the Ratio
Ether’s relative valuation moves on two independent inputs. The first is what happens on the bitcoin side, which the October breakdown in ether tracked while ETF flows and large holders were selling. The second is what happens on the Ethereum side, where the cost of using the chain is under revision and where the proposal process, not a marketing calendar, sets the timing.
For a reader deciding what to do, the honest summary is narrow. Ether is down 17.0% in dollars and 7.9% in bitcoin terms over six weeks, the ratio is in the lower half of its 30-day band, and the nearest documented change on the network is a gas-cost repricing that no published document assigns to a dated upgrade. Everything beyond that is a view about flows, and views are not data.
Frequently Asked Questions
Ether traded at $2,234.61 at 04:42 UTC on 8 November 2026, with Coinbase at $2,233.32 and Kraken at $2,233.73 in the same minutes. Its market capitalization was $273.10 billion.
Over the 30 sessions to 8 November ether fell 17.0% while bitcoin fell 9.9%, and the ETH/BTC ratio moved from 0.030202 on 10 October to 0.029466. The price data establishes the size of the move, not its cause.
$8,182.38 per ETH at the implied supply of 122.21 million coins, which is 3.66 times the 8 November price. Bitcoin’s equivalent threshold, $49,720.90, is already below its current price.
On Kraken daily closes the 30-session range is $2,170.00 to $2,576.94, and the seven-session range is $2,201.26 to $2,447.27. Spot at $2,234.61 is 2.9% above the 30-day low.
EIP-8037 and EIP-8038, which change state creation and state access gas costs, are marked Last Call with a listed deadline of 1 November 2026 and remain under peer review. The published pages do not name the upgrade that will carry them.
Data: Coinbase , Kraken , CoinGecko . Prices are a snapshot at 04:42 UTC on 8 November 2026.
This article is for information only and is not investment advice. Market data is a snapshot taken at the times stated and will change.