



Bitcoin is approaching one of its most important technical tests in months as the world’s largest cryptocurrency challenges a long-term descending trendline near $65,000. At the same time, on-chain data suggests large investors continue accumulating while retail traders reduce exposure, a combination that has historically preceded major market recoveries.
Although analysts warn that Bitcoin could still revisit the $52,000 to $55,000 region in a worst-case scenario, improving whale activity and growing inflows into spot Bitcoin ETFs suggest the broader market may be preparing for its next leg higher.
Bitcoin Tests Major Resistance as Whales Continue Accumulating
Bitcoin is once again confronting the descending trendline that has capped every major recovery attempt since late 2025, making the coming sessions especially important for determining the market’s next direction.
The resistance line, which currently intersects near $64,700 to $65,000, has already rejected Bitcoin twice this year. A third rejection would preserve the existing pattern of lower highs and keep the broader downtrend intact. Conversely, a decisive daily close above the trendline would represent the strongest technical signal yet that sellers are beginning to lose control.
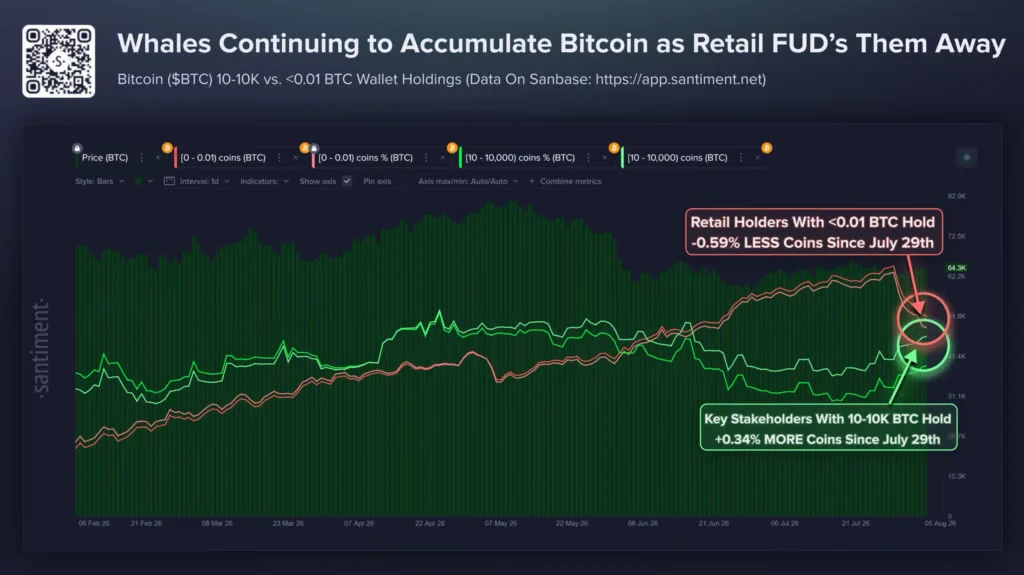
According to Santiment, wallets holding between 10 and 10,000 BTC have increased their balances by 0.34% since July 29, while wallets holding less than 0.01 BTC have reduced their holdings by 0.59%. The divergence highlights a familiar pattern in which institutional investors and large holders accumulate Bitcoin as retail participants continue capitulating.
Santiment believes this shift in ownership increases the probability of Bitcoin breaking above $70,000 rather than falling below $60,000, particularly if accumulation continues over the coming weeks.
Institutional demand remains another supportive factor. U.S. spot Bitcoin ETFs have attracted approximately $755 million in net inflows so far this month, lifting total assets under management to nearly $79 billion. Continued ETF demand has provided a steady source of buying pressure throughout the current consolidation phase and reinforces the longer-term bullish outlook.
Can Bitcoin Hold Support if the Breakout Fails?
While Bitcoin’s improving on-chain metrics have strengthened sentiment, technical analysts remain cautious until resistance is decisively broken.
A separate weekly analysis outlines a bearish scenario in which Bitcoin loses its current support zone before completing a final liquidity sweep toward the $52,000 to $55,000 area. Rather than representing a base case, the move is described as the analyst’s worst-case scenario before a broader recovery begins.
The current support region stretching from the mid-$50,000s into the low-$60,000s has repeatedly attracted buyers over recent months. A sustained breakdown below that range, particularly beneath the $52,000 level , would weaken Bitcoin’s longer-term structure and increase downside risks.
$BTC
— TheoTrader ? (@theo_crypto99) August 6, 2026
This is my absolute worst case scenario. pic.twitter.com/CE0fvuFeBZ
However, if BTC briefly sweeps those lower liquidity levels before quickly reclaiming support, the move could resemble previous swing failure patterns that have historically marked important market bottoms.
For now, the more immediate focus remains on the descending trendline around $65,000. A successful breakout would invalidate months of lower highs and could shift attention toward the next major resistance zone between $80,000 and $83,000.
Momentum has also begun improving. Bitcoin has gained more than 4% over the past month, while several on-chain indicators suggest the asset may already have formed a macro bottom following one of the deepest periods of unrealized losses among holders.
CoinCheckup Bitcoin Price Prediction
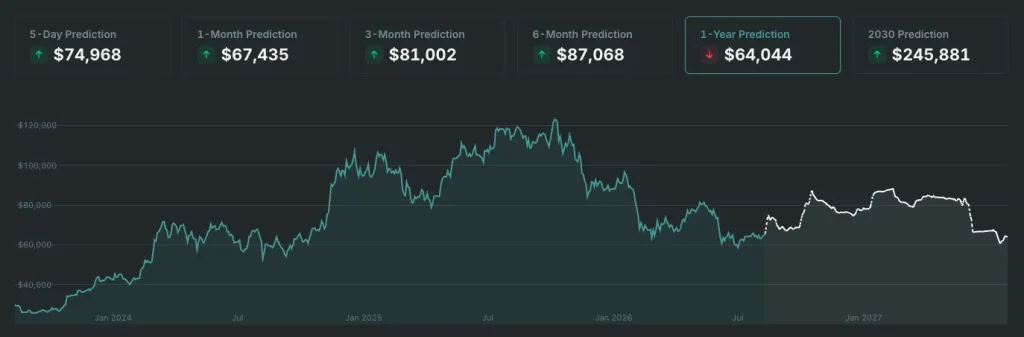
According to crypto analysis platform CoinCheckup, BTC is projected to gradually strengthen through the remainder of 2026 before reaching its strongest performance in the first half of 2027.
The forecast suggests Bitcoin may climb above $70,000 during August and September as buyers continue rebuilding momentum following the recent consolidation. October stands out as one of the strongest months of the year, with projected average prices approaching $83,000 and maximum targets exceeding $87,000, indicating that a successful breakout above current resistance could accelerate bullish momentum.
Following that advance, CoinCheckup expects Bitcoin to enter a healthy consolidation phase during November and December. Average prices are projected to remain comfortably in the mid-to-upper $70,000 range, suggesting the market could retain much of its gains while establishing a higher support base.
The outlook turns constructive again in early 2027. January and February project average prices above $83,000 and $85,000 respectively, while maximum targets remain close to $88,000. Although the forecast points to more moderate price action during the spring, Bitcoin is expected to continue trading well above current levels for much of the year.
By the middle of 2027, the model anticipates increased volatility and a gradual cooling of momentum. Average prices trend lower during June, July, and August, although projections still suggest Bitcoin could hold substantially above the lows seen during the current bear market.