XRP may be quietly setting the stage for another major breakout. Recent chart patterns and market behavior show striking similarities to its 2017 accumulation phase, a period that preceded a massive parabolic rally . As Q4 unfolds, technical indicators and Bitcoin dominance data hint that the long-awaited bullish setup could still be in play.
Q4 Move Still Possible: XRP’s Bullish Potential Isn’t Gone Yet
Crypto analyst CoinsKid recently shared an update confirming that the highly anticipated Q4 move for XRP is still a potential option. This optimistic outlook is heavily underpinned by the current data observed on the Bitcoin Dominance (BTC.D) chart, which the analyst views as a crucial barometer for altcoin performance. If BTC.D shows weakness, capital typically flows into assets like XRP, supporting the potential for a significant surge in the coming months.
However, CoinsKid pointed out that the recent loss of the $1.90 low last Friday introduced what he described as a structural anomaly into the equation. This development adds a layer of uncertainty to XRP’s short-term outlook, even as the broader setup continues to show potential.
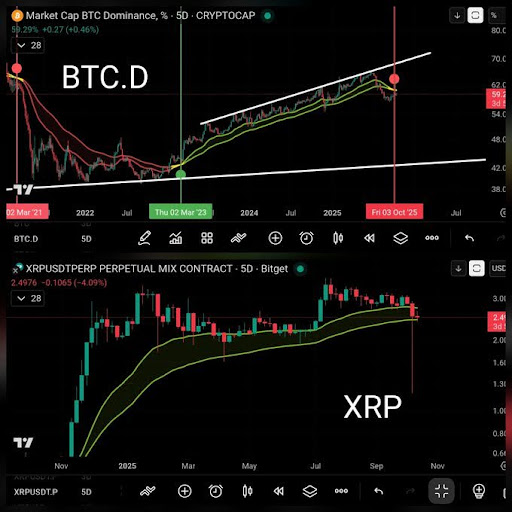
He further explained that for this bullish scenario to remain valid, Bitcoin dominance must stay below its 5-day resistance level on the CoinskidRibbon. At the same time, XRP needs to hold above its own 5-day CoinskidRibbon as support.
Wyckoff Blueprint In Motion: XRP Mirrors Its 2017 Setup
EᴛʜᴇʀNᴀꜱʏᴏɴᴀL, in a recent update , highlighted that XRP is currently positioned within a major accumulation area, signaling that a crucial phase may be unfolding for the asset. According to the analyst , the current market structure strongly mirrors the early stages of a Wyckoff accumulation pattern, a technical formation that often precedes large-scale bullish movements.
The Wyckoff method identifies this accumulation phase as a period where smart money quietly builds positions while the price remains range-bound. This typically occurs after extended declines, setting the stage for a powerful reversal once the market confirms strength.
From a technical perspective, this accumulation structure indicates growing pressure beneath key support zones, which often leads to a strong bullish cycle once a breakout occurs. The repeated testing of support levels, combined with diminishing selling volume, strengthens the case for a potential upside breakout in the near term.
EᴛʜᴇʀNᴀꜱʏᴏɴᴀL also drew parallels to XRP’s behavior in the 2017 cycle, when a similar accumulation phase preceded one of the asset’s most explosive rallies, with XRP climbing all the way to the distribution zone, where profits were eventually taken. If history repeats, the altcoin could once again be on the verge of a powerful upward run.