


BTC price remains below the resistance level at $100,000 and the 50-day moving average as investors stay in the sidelines. However, Bitcoin has flashed a rare buy signal that could mark the end of the ongoing bearish trend.
BTC Price Flashes Rare Bullish Sign
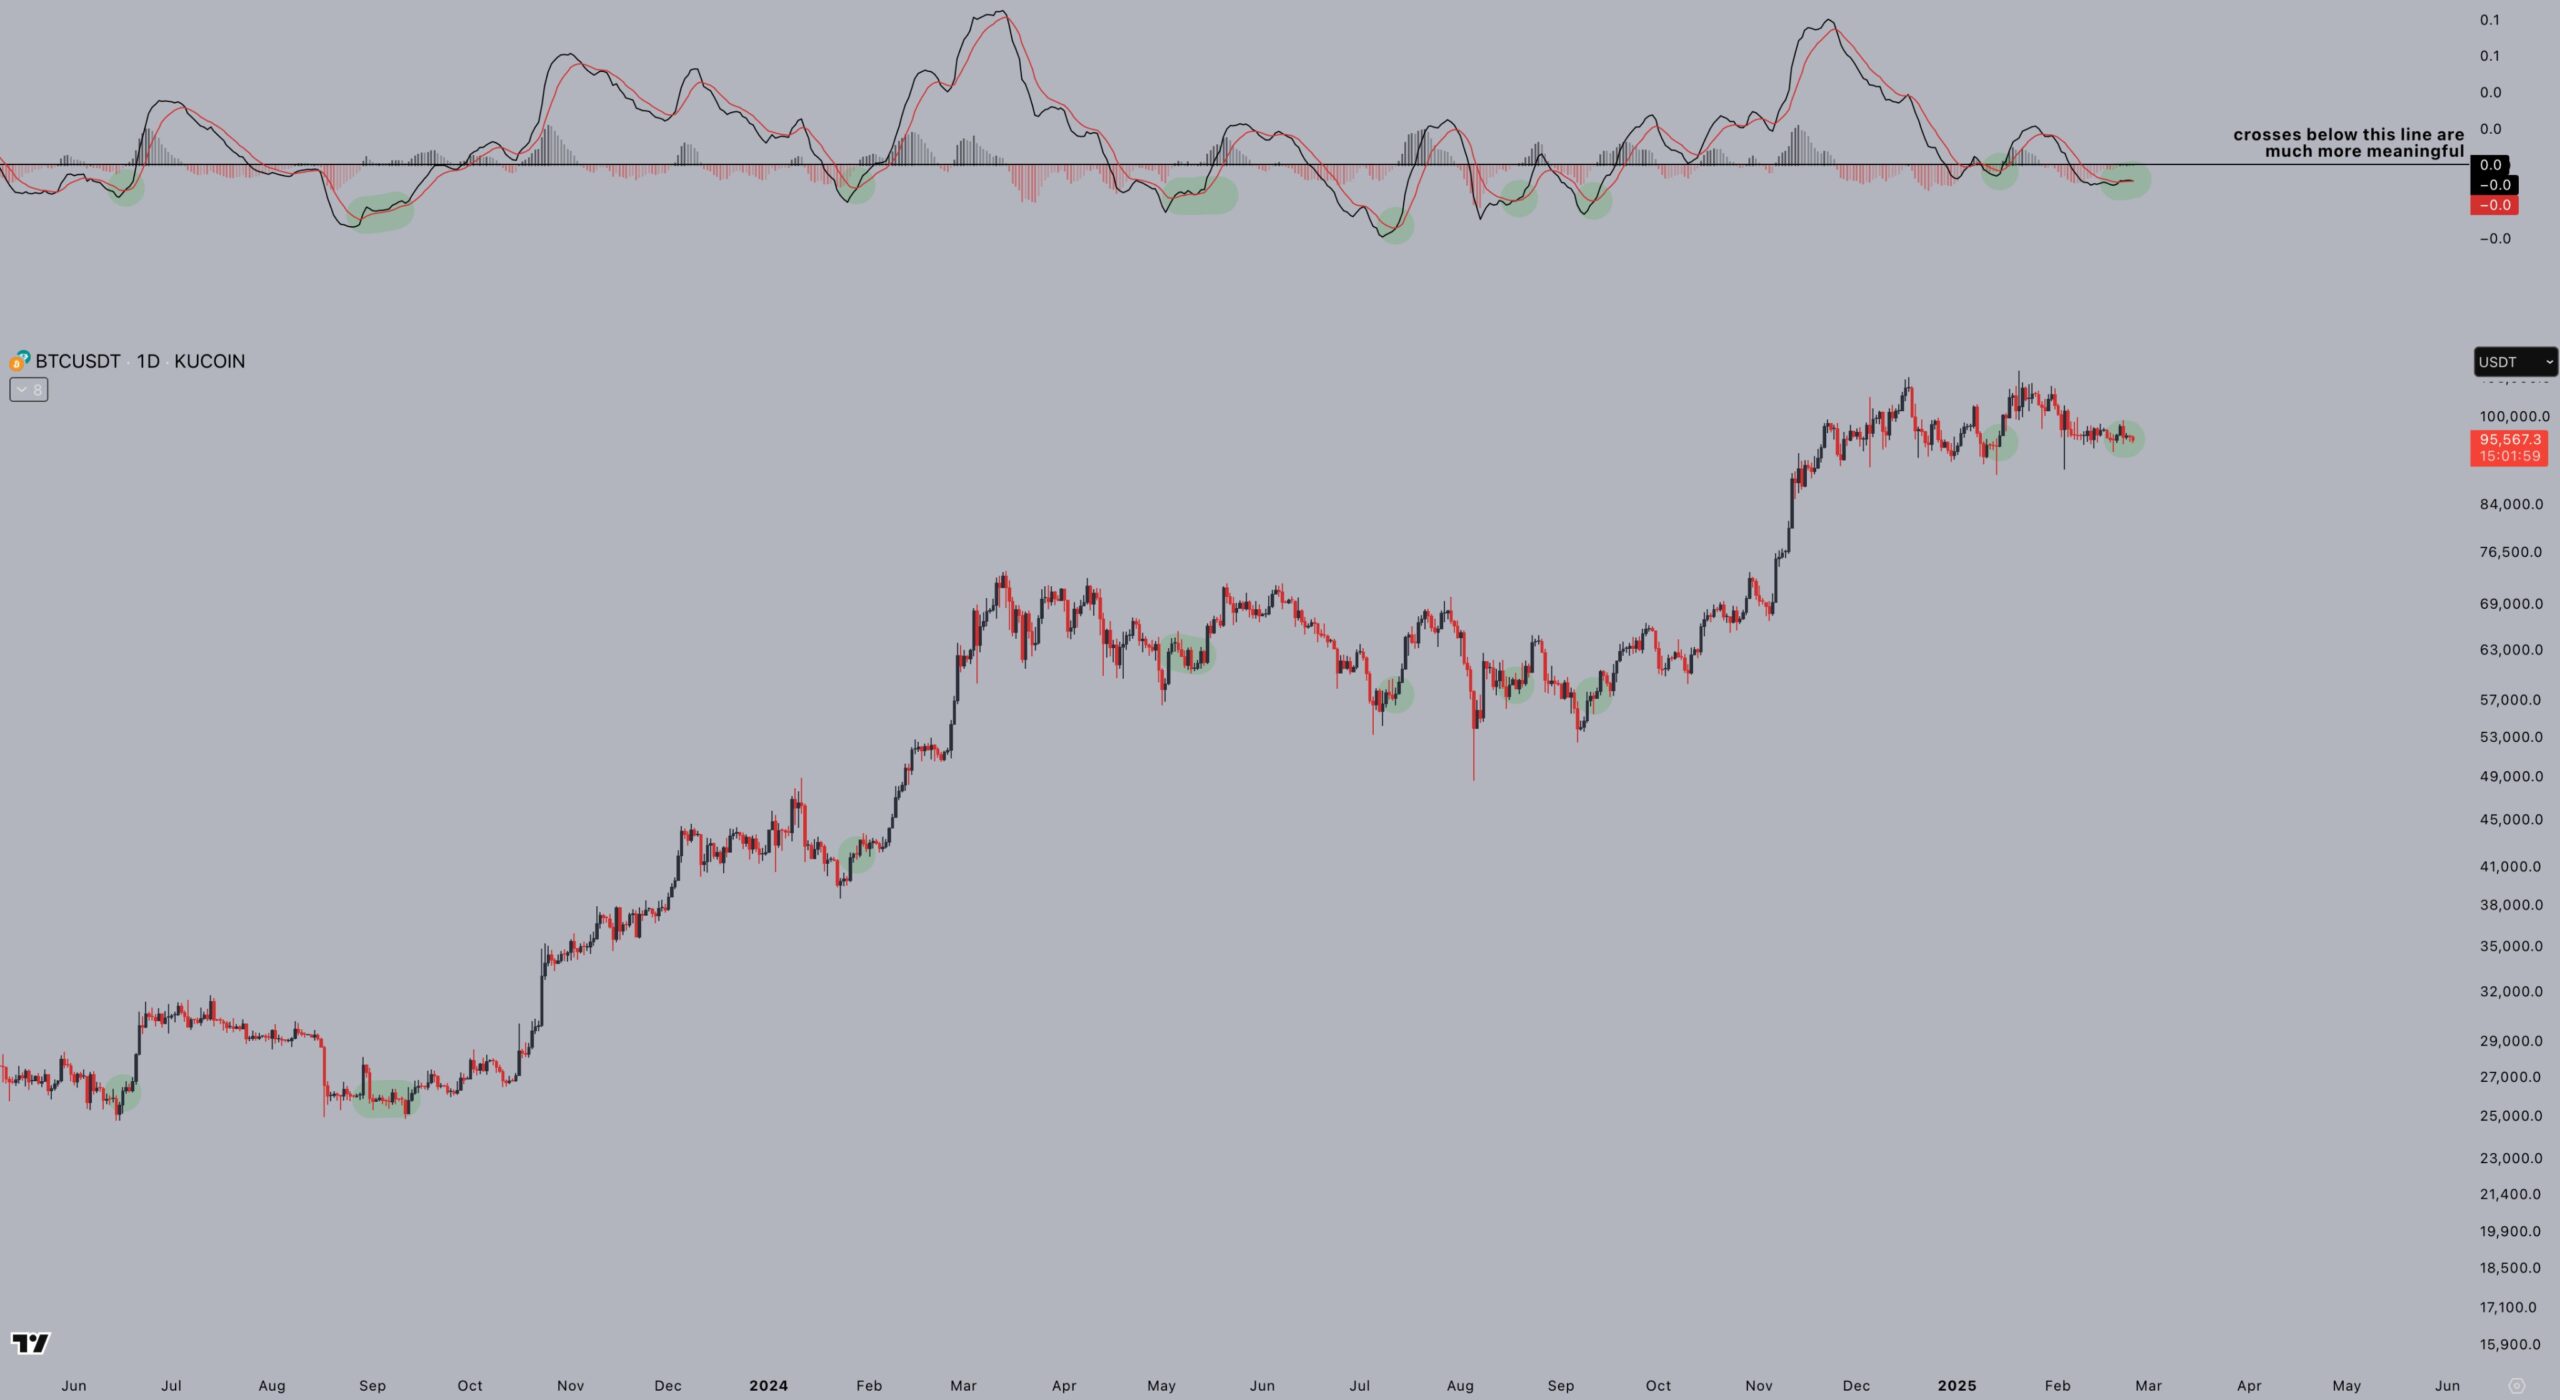
Bitcoin may have more upside, ending the recent downward trend. According to Jelle , a popular anonymous crypto analyst on X, the coin has flashed a bullish pattern on the daily chart. He pointed to the moving average convergence and divergence (MACD) pattern that has formed a bullish crossover.
The last time this crossover happened was on January 15 and the BTC price rose by 16% afterwards. It also formed the crossover in September when Bitcoin was trading at around $60,000. It staged a strong rally and peaked at its all-time high of $109,200.
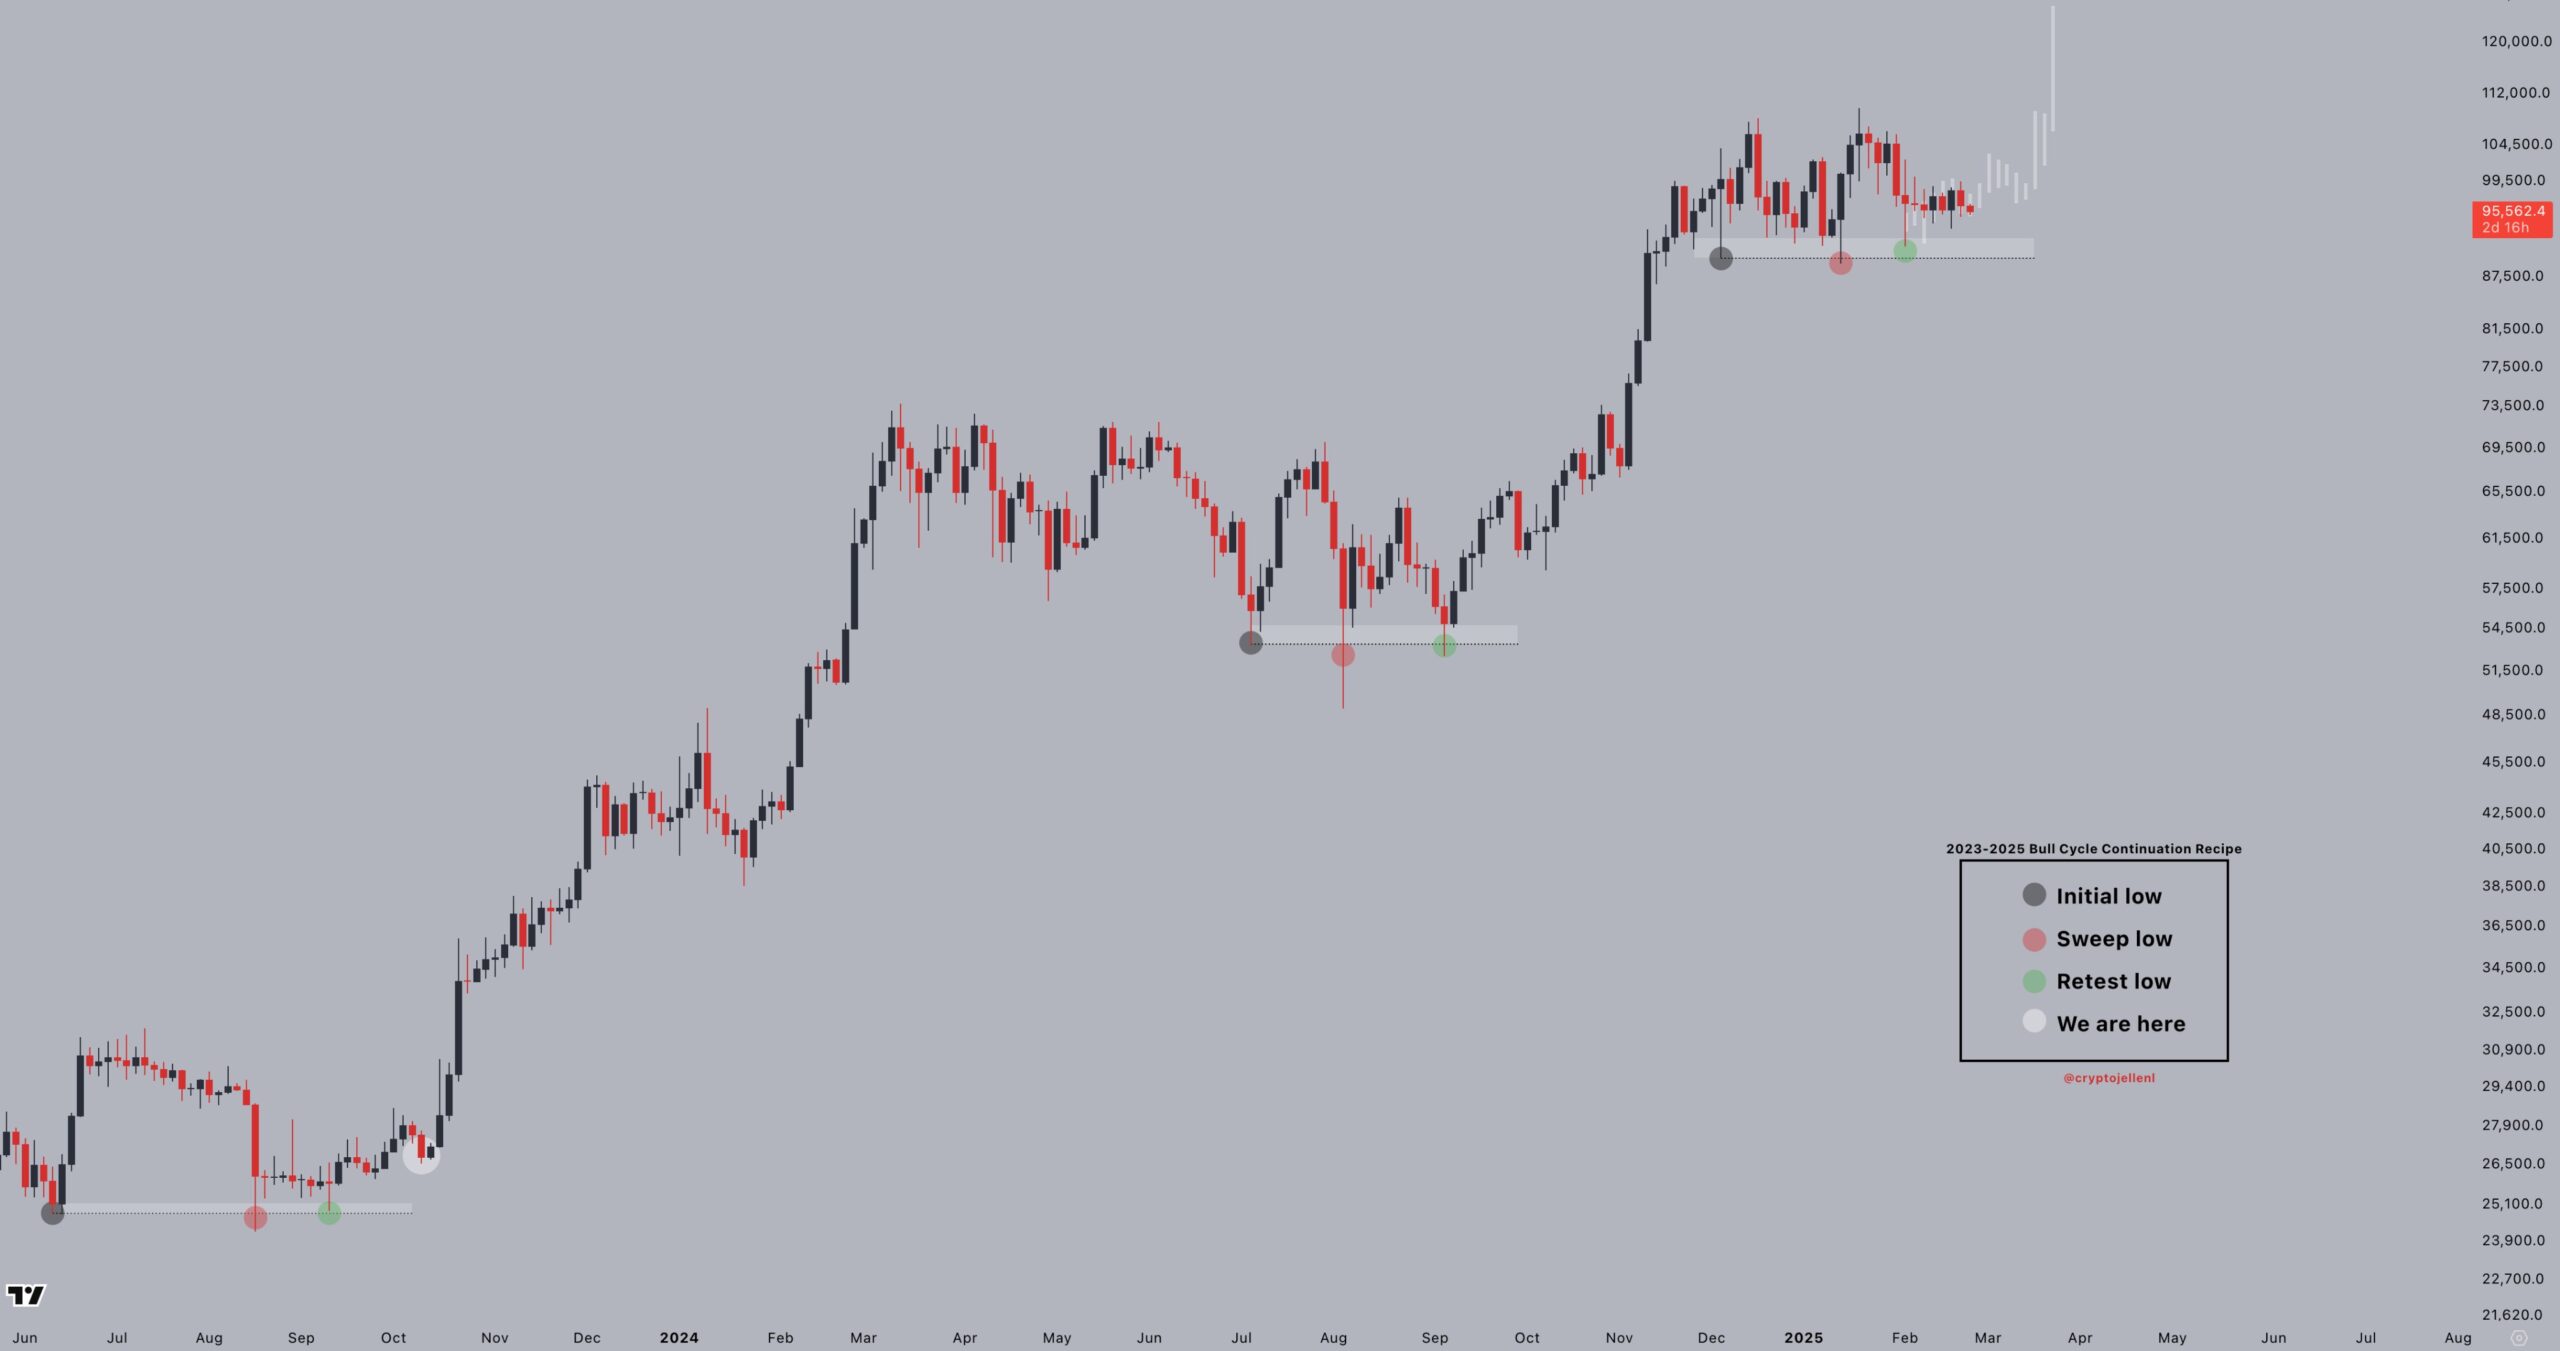
In another X post, Jelle noted that Bitcoin had formed a pattern mirroring what it did between June and September last year. It made an initial swoop in June followed by the swoop low in August, and the retest swoop in September and then rallied. He has identified similar swoop levels during the ongoing consolidation.
Bitcoin Price Has More Bullish Catalysts
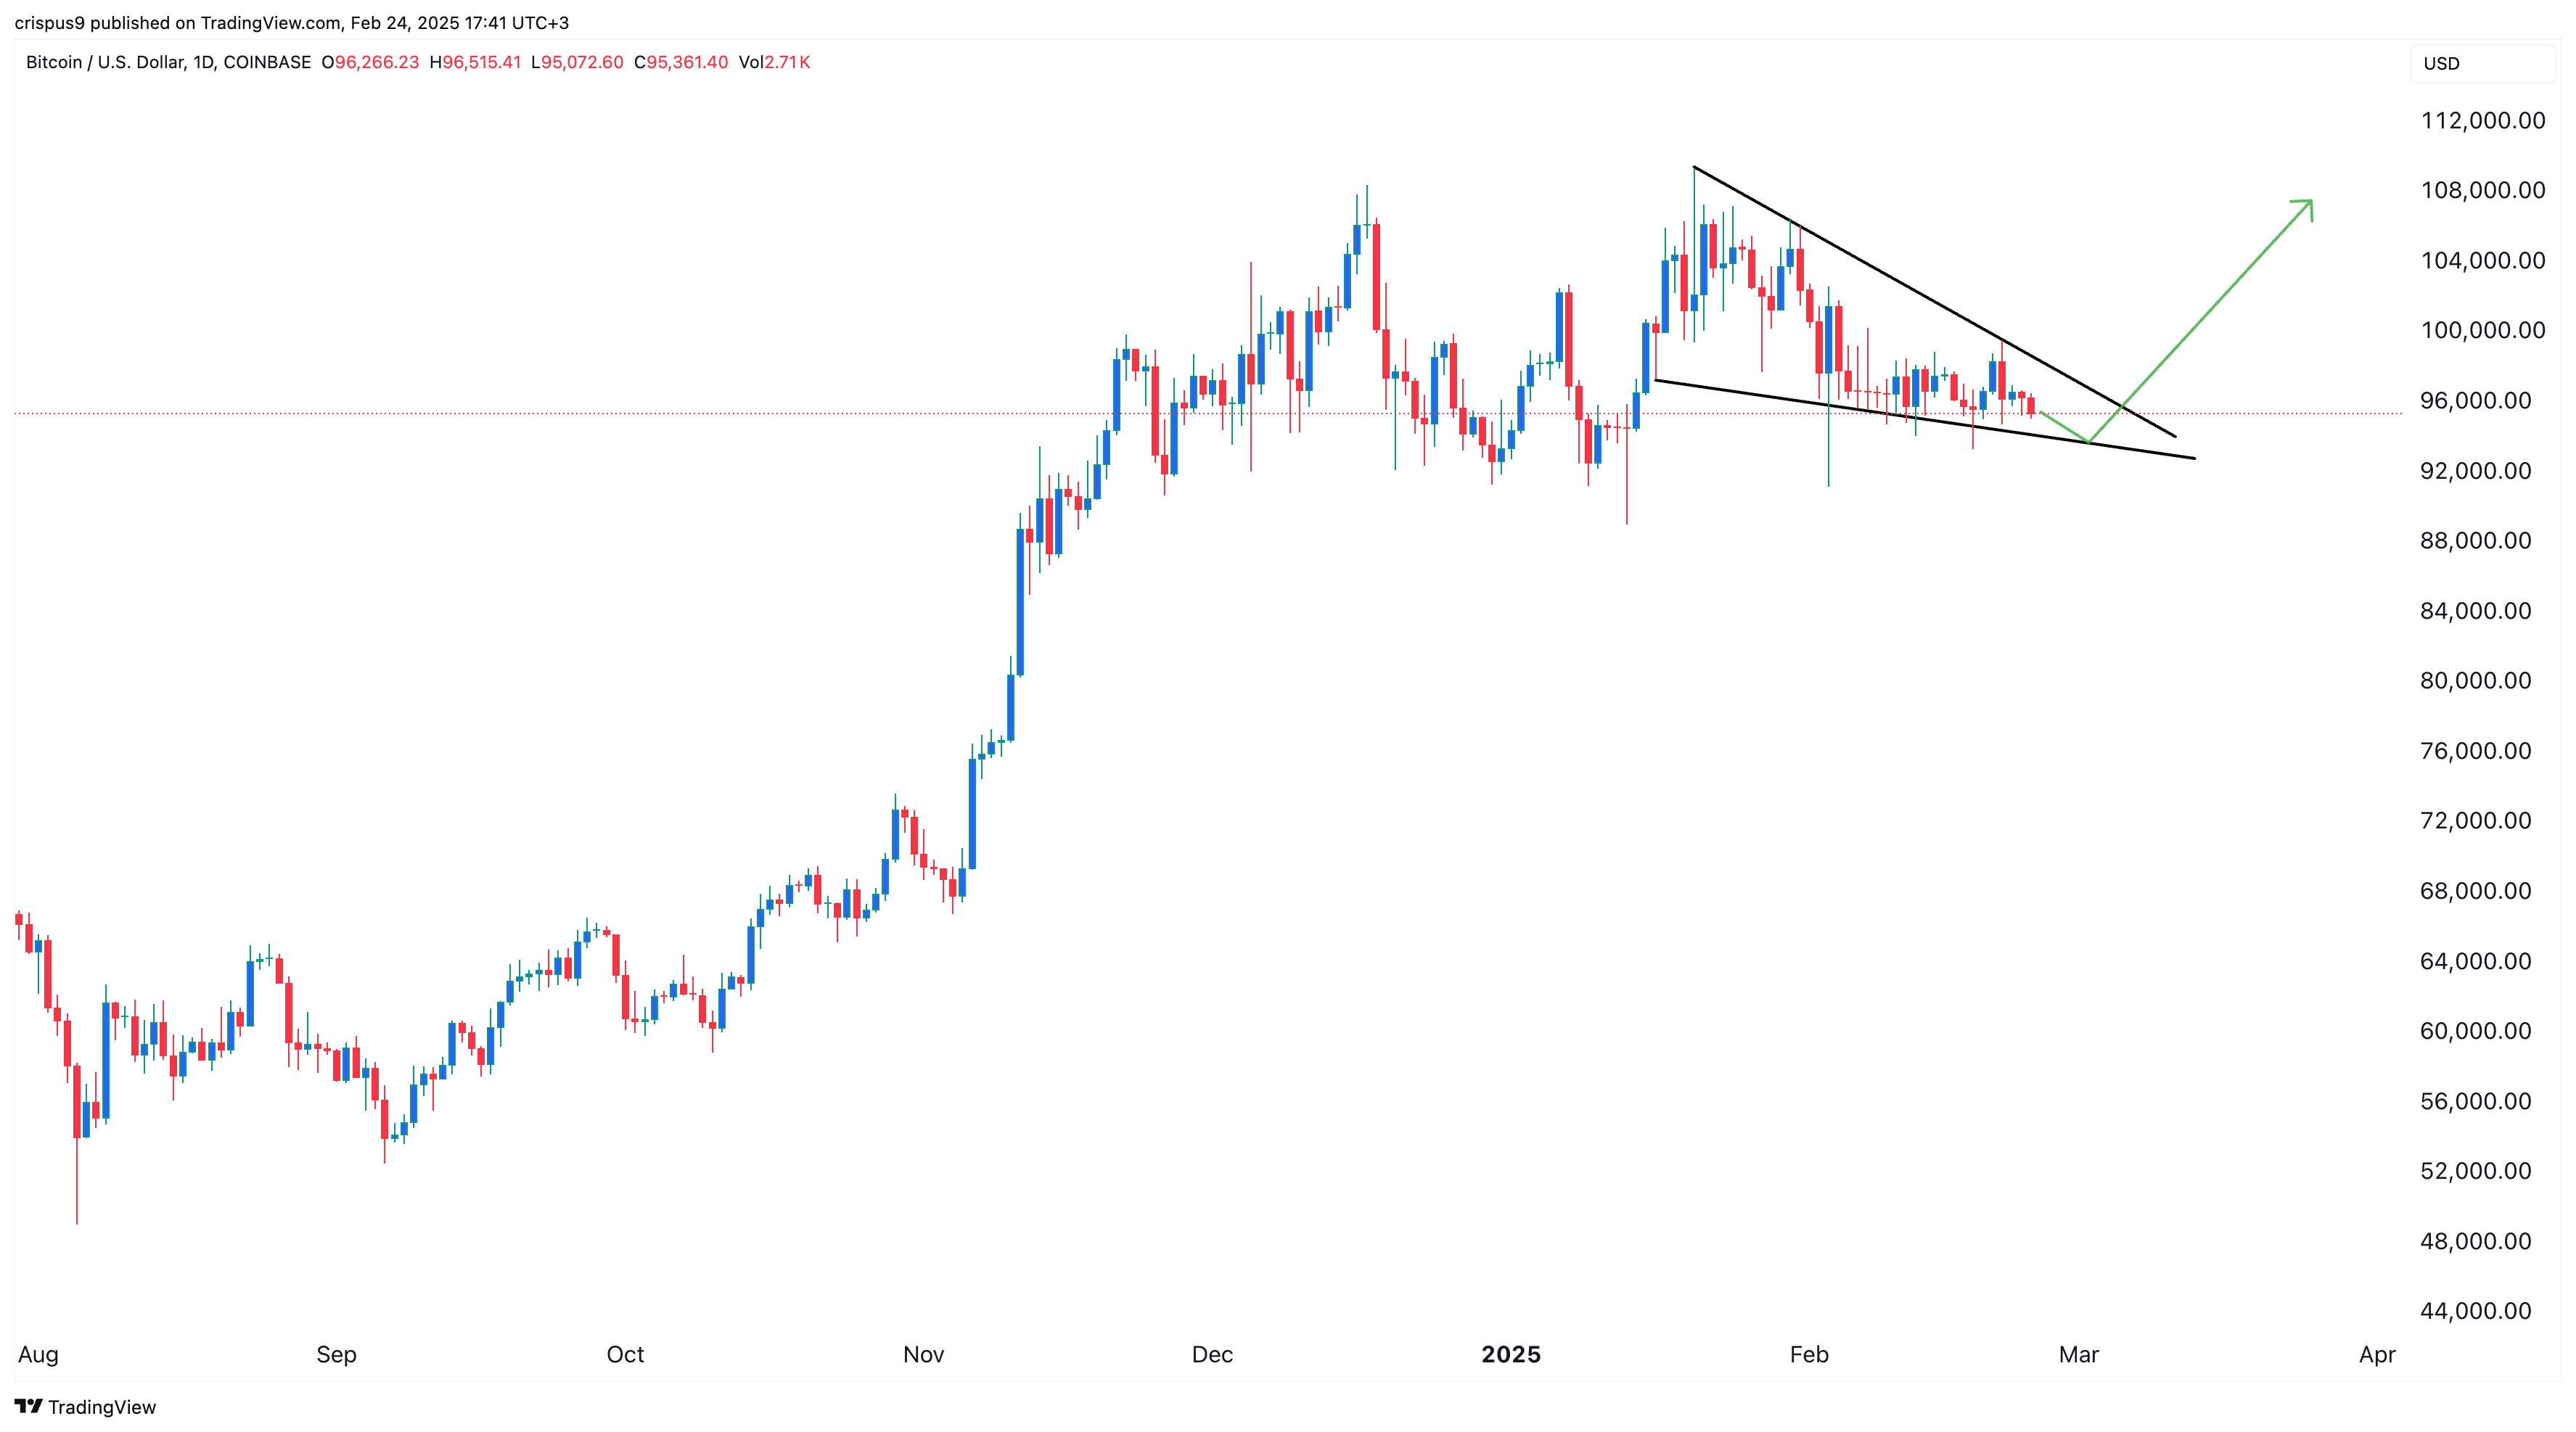
Technicals show that Bitcoin price has more bullish catalysts that may push it higher from the ongoing consolidation. The first catalyst is that the coin has formed a falling wedge pattern , which comprises two falling and converging trendlines. A rebound usually happens when the two lines are about to converge, which is happening now.
Most importantly, the longer-term chart points to a rebound since it has formed two rare and bullish patterns. First, it formed a cup and handle pattern between November 2021 and March last year. The handle section happened between March and November, leading to a strong bullish breakout to the all-time high of $109,200.
As shown below, by measuring the cup’s depth and then measuring the same distance from the cup’s upper side, the Bitcoin price target is $123,000.
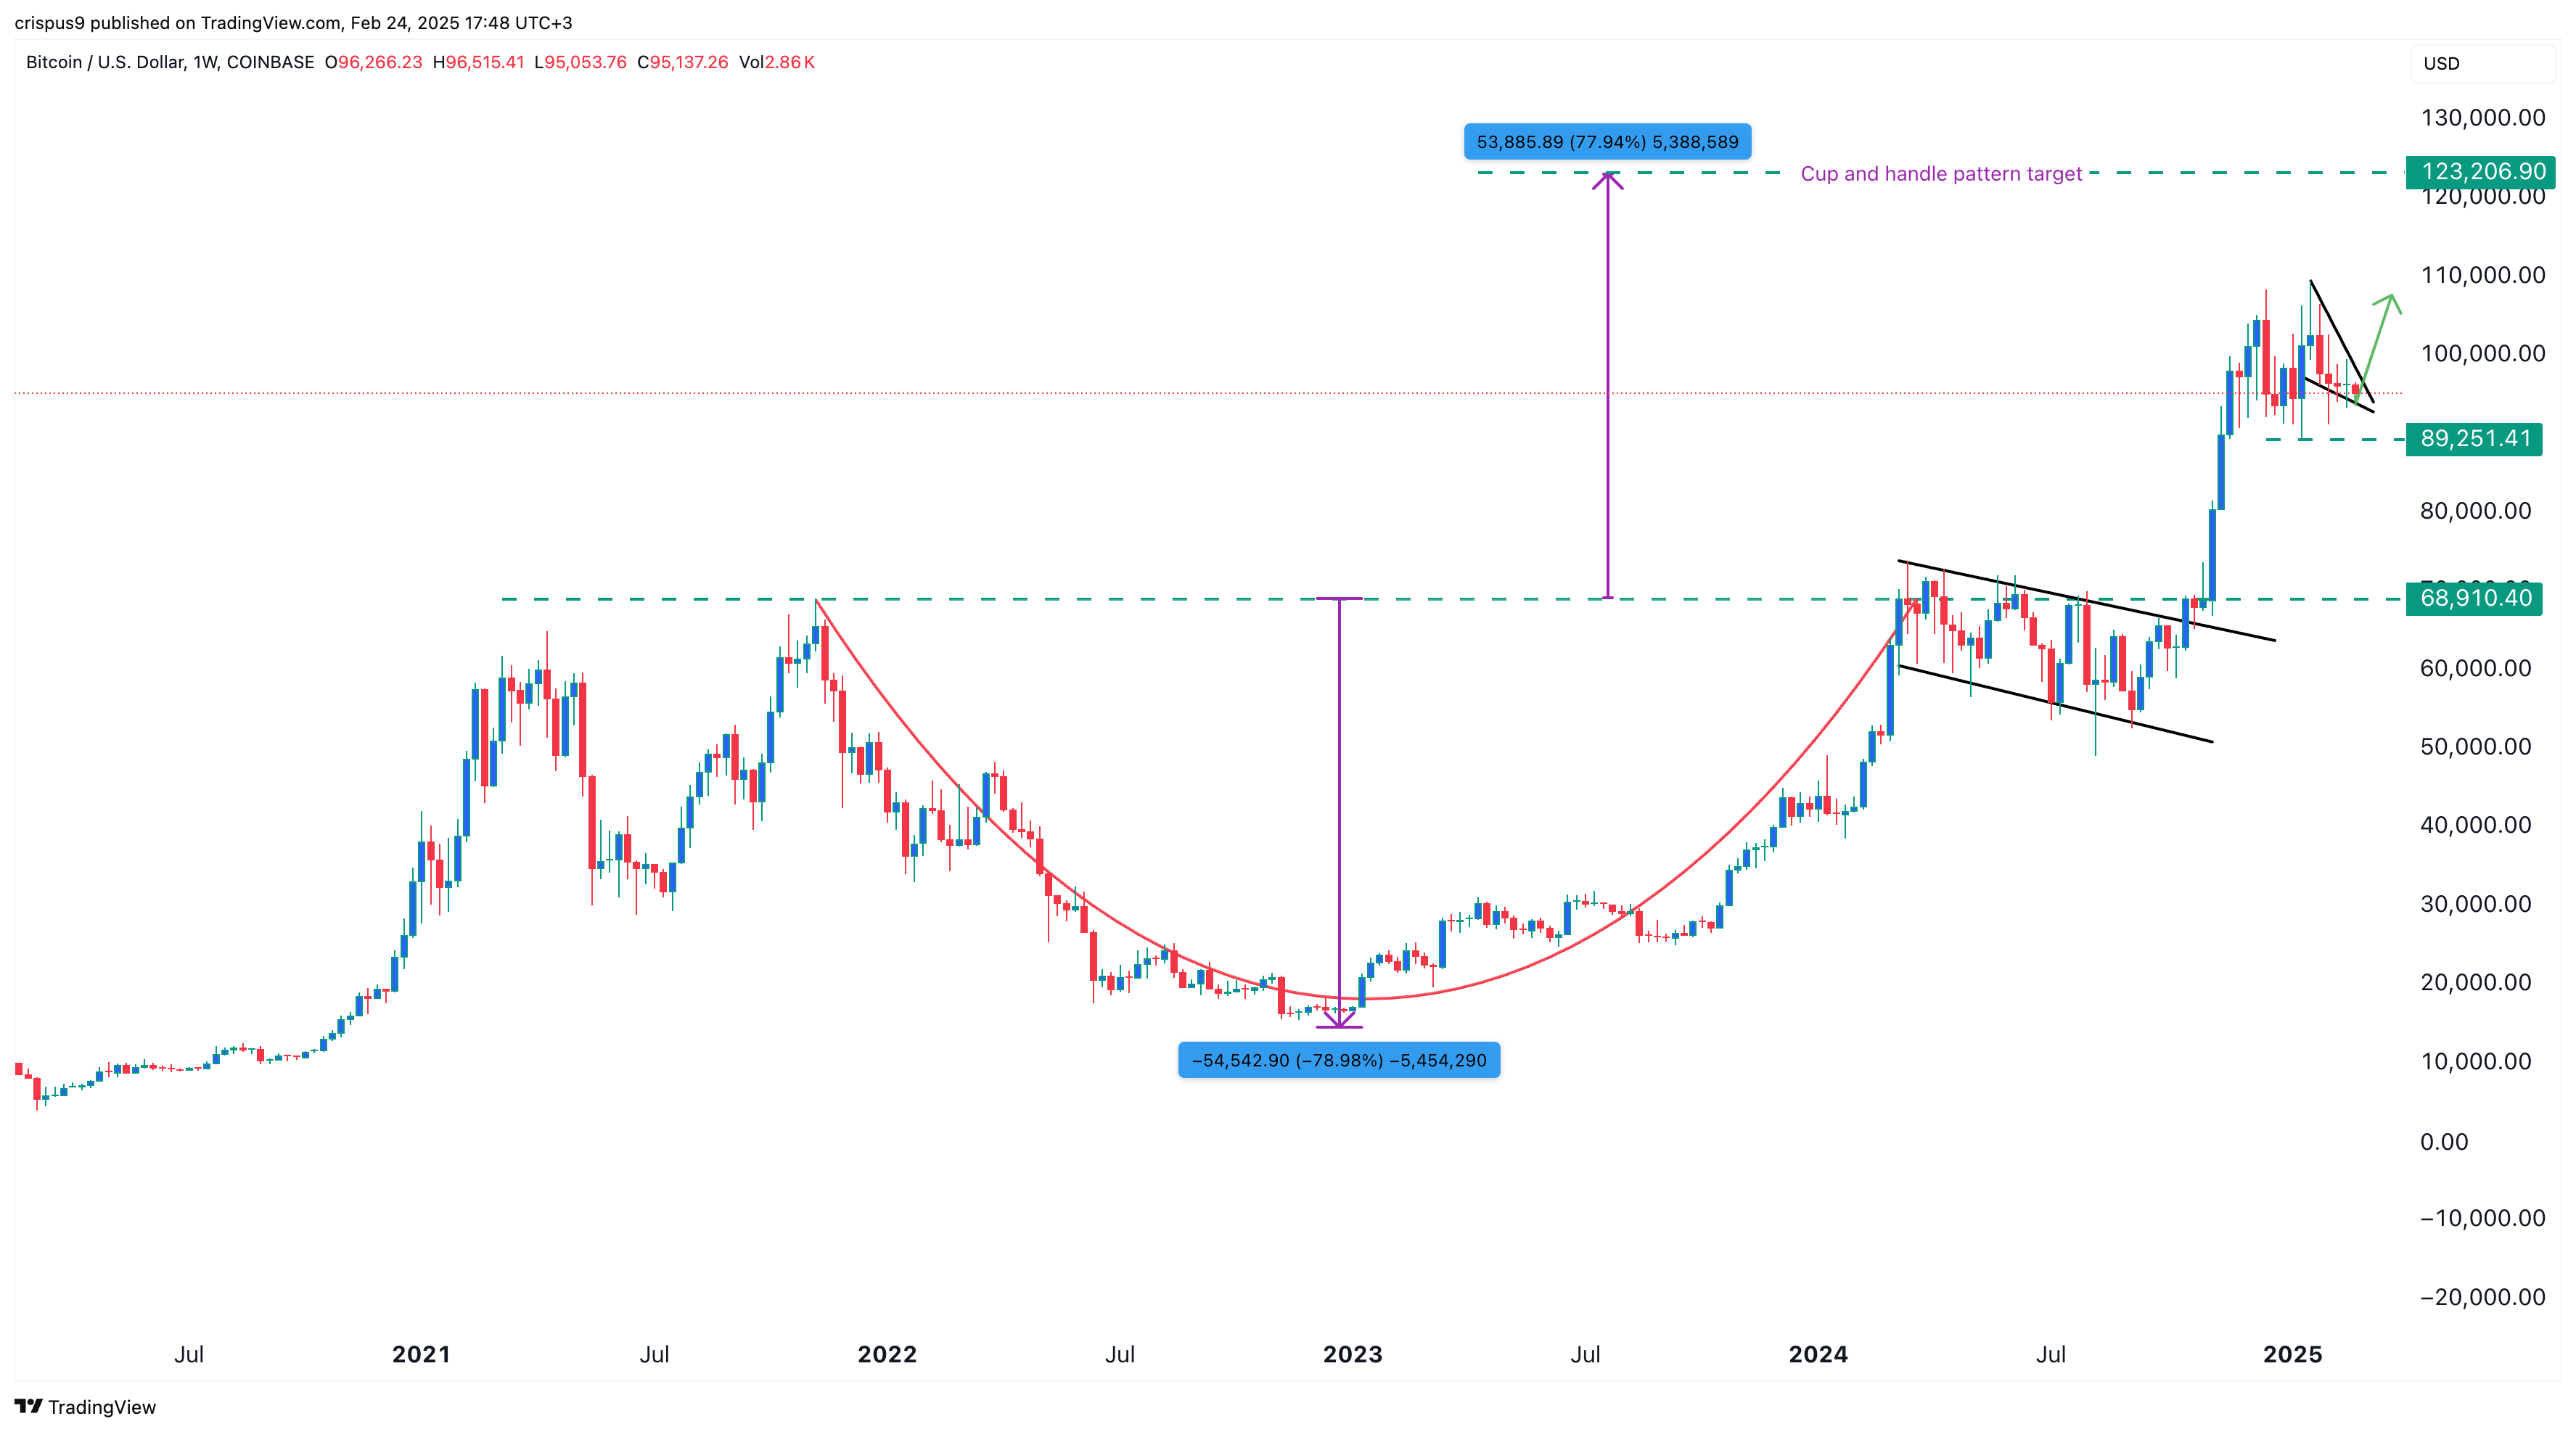
This chart also shows that the BTC price has formed a bullish flag pattern, which has a tall vertical line and some consolidation. This pattern also leads to more gains.
The bullish Bitcoin price forecast will become invalid if the coin drops below the key support at $89,250, the lower side of the pennant’s triangle.
The post BTC Price Flashes Buy Signal: Is This End of Bitcoin’s Bearish Trend? appeared first on CoinGape .